Your supply chain is either making you money or losing it. Every stockout costs a sale. Every delay frustrates a customer. Every inefficient route burns fuel and time. Enterprises lose 15-25% of potential revenue to supply chain inefficiency, but most don't realize it because the costs are spread across dozens of small problems.
Supply chain automation transforms these hidden losses into competitive advantages. This guide shows you exactly which processes to automate, the enterprise-grade technologies available, and how to implement automation that delivers measurable results—whether you're a growing business or a large enterprise.
Supply Chain as a Revenue Driver
Most businesses view their supply chain as a cost center—something to minimize rather than optimize. This mindset leaves massive value on the table.
Consider how supply chain efficiency directly impacts revenue:
-
Product availability: You can't sell what you don't have. Stockouts cost the average retailer 4% of annual revenue (Gartner).
-
Customer satisfaction: 84% of consumers say they won't return to a brand after a poor delivery experience (Convey).
-
Competitive positioning: In e-commerce, delivery speed is often the deciding factor. Amazon didn't win on price—they won on logistics.
-
Working capital: Excess inventory ties up cash that could fund growth. Poor inventory management means choosing between stockouts and cash constraints.
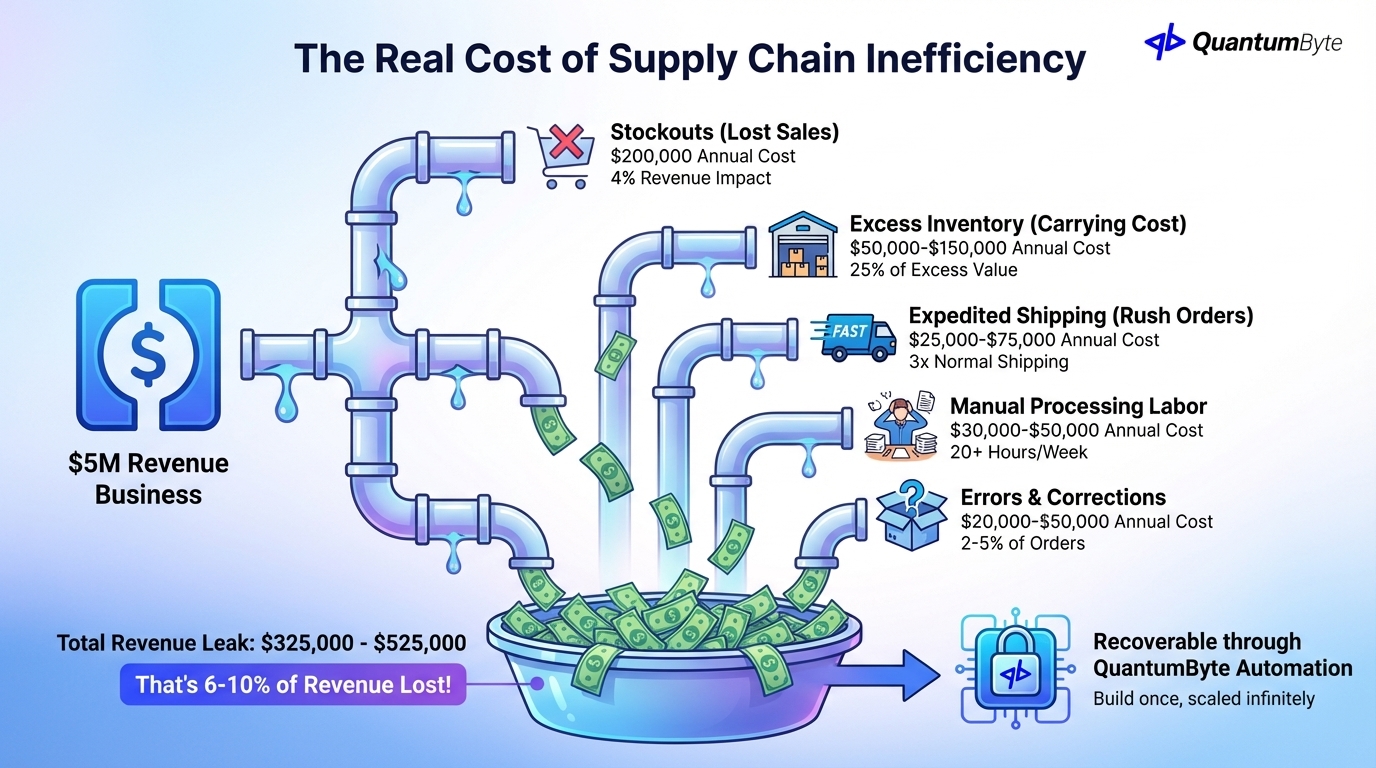
The Real Cost of Supply Chain Inefficiency
For enterprises, supply chain inefficiency compounds across scale. For a $5M revenue business, it typically costs:
| Inefficiency Type | Typical Impact | Annual Cost |
|---|---|---|
| Stockouts (lost sales) | 4% of revenue | $200,000 |
| Excess inventory (carrying cost) | 25% of excess value | $50,000-150,000 |
| Expedited shipping (rush orders) | 3x normal shipping | $25,000-75,000 |
| Manual processing labor | 20+ hours/week | $30,000-50,000 |
| Errors and corrections | 2-5% of orders | $20,000-50,000 |
| Total | $325,000-525,000 |
That's 6-10% of revenue lost to inefficiency—recoverable through automation.
10 Supply Chain Processes Ripe for Automation
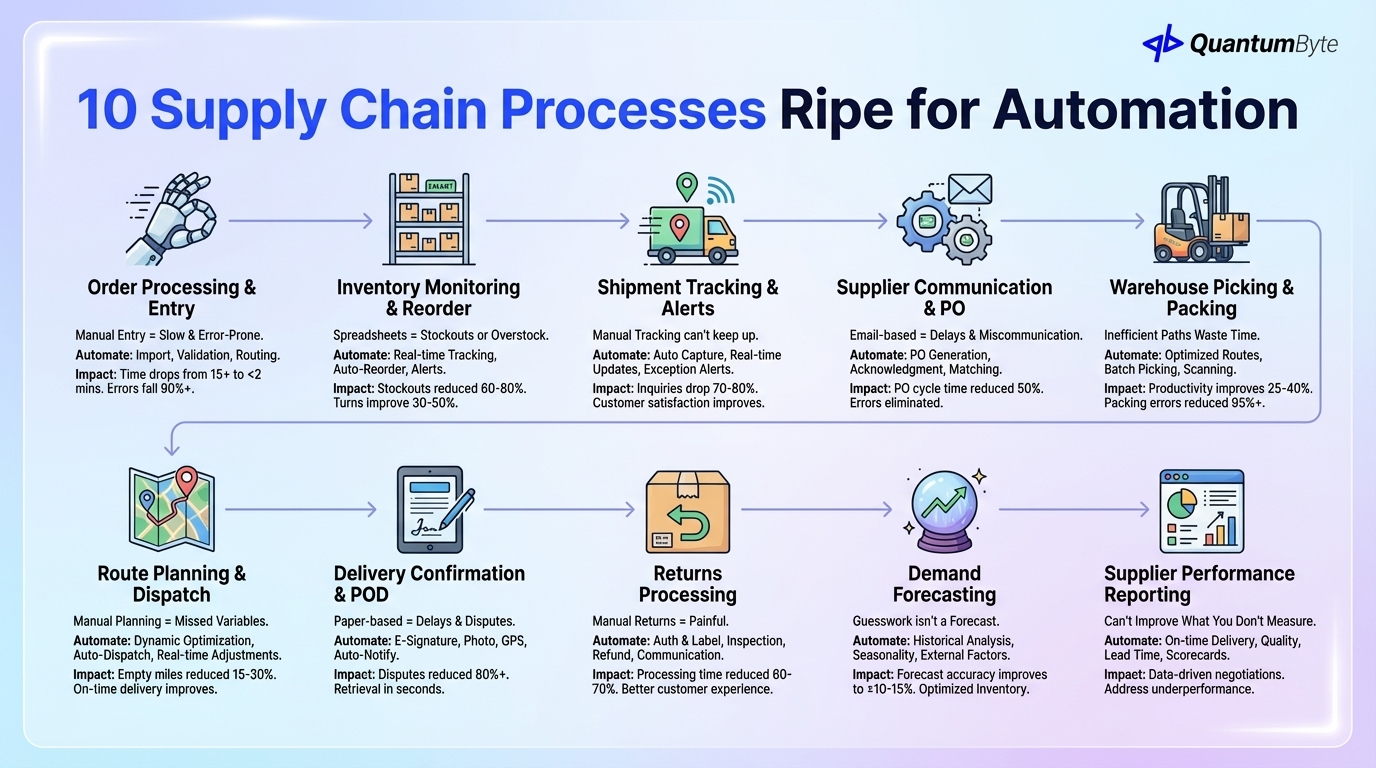
Not every process delivers equal returns. These ten consistently provide the highest impact:
1. Order Processing and Entry
Manual order entry is slow, error-prone, and doesn't scale.
What to automate:
- Order import from all sales channels (website, marketplaces, phone, email)
- Data validation and error flagging
- Inventory allocation and availability checking
- Order confirmation and acknowledgment
- Routing to fulfillment
Impact: Order processing time drops from 15+ minutes to under 2 minutes per order. Error rates fall by 90%+.
2. Inventory Level Monitoring and Reorder Triggers
Spreadsheet-based inventory tracking guarantees either stockouts or overstock—usually both.
What to automate:
- Real-time inventory level tracking across locations
- Automated reorder point calculations
- Purchase order generation when thresholds hit
- Safety stock adjustments based on demand patterns
- Low stock alerts and notifications
Impact: Stockouts reduced by 60-80%. Inventory turns improve by 30-50%.
3. Shipment Tracking and Exception Alerts
Customers expect visibility. Manual tracking can't keep up.
What to automate:
- Automatic tracking number capture from carriers
- Real-time status updates to customers
- Exception detection (delays, missed scans, delivery failures)
- Proactive communication when issues arise
- Delivery confirmation capture
Impact: "Where's my order?" inquiries drop by 70-80%. Customer satisfaction improves measurably.
4. Supplier Communication and PO Management
Email-based supplier management creates delays and miscommunication.
What to automate:
- Purchase order generation and transmission
- Order acknowledgment tracking
- Ship date confirmation and updates
- Invoice matching and discrepancy flagging
- Supplier performance scoring
Impact: PO cycle time reduced by 50%. Supplier communication errors virtually eliminated.
5. Warehouse Picking and Packing Optimization
Inefficient picking paths waste time on every order.
What to automate:
- Pick list generation with optimized routes
- Batch picking for multiple orders
- Barcode scanning for accuracy
- Packing verification and labeling
- Shipping method selection
Impact: Picking productivity improves 25-40%. Packing errors reduced by 95%+.
6. Route Planning and Dispatch
Manual route planning can't optimize for all variables.
What to automate:
- Dynamic route optimization considering traffic, capacity, and constraints
- Auto-dispatch to drivers based on location and load
- Real-time adjustments for new orders or changes
- Driver communication and instruction delivery
- Proof of delivery capture
Impact: Empty miles reduced by 15-30%. On-time delivery rates improve significantly.
7. Delivery Confirmation and Proof of Delivery
Paper-based delivery confirmation creates delays and disputes.
What to automate:
- Electronic signature capture
- Photo documentation of delivery
- Timestamp and GPS location recording
- Automatic customer notification
- Exception reporting for failed deliveries
Impact: Delivery disputes reduced by 80%+. Proof retrieval time from hours to seconds.
8. Returns Processing
Returns are inevitable. Manual returns processing is not.
What to automate:
- Return authorization and label generation
- Receipt and condition inspection logging
- Inventory restock or disposition routing
- Refund or exchange processing
- Customer communication throughout
Impact: Returns processing time reduced by 60-70%. Customer satisfaction with returns experience improves.
9. Demand Forecasting
"Last year plus 10%" isn't a forecast—it's a guess.
What to automate:
- Historical demand pattern analysis
- Seasonality and trend detection
- Promotional impact modeling
- External factor integration (weather, events, economic indicators)
- Forecast accuracy tracking and refinement
Impact: Forecast accuracy improves from ±30% to ±10-15%. Inventory investment optimization follows.
10. Supplier Performance Reporting
You can't improve what you don't measure.
What to automate:
- On-time delivery rate tracking
- Quality metrics compilation
- Price variance analysis
- Lead time monitoring
- Scorecards and trend reporting
Impact: Data-driven supplier negotiations. Underperforming suppliers identified and addressed.
Revenue Impact of Supply Chain Automation
Let's quantify the returns across key benefit categories:
Reduced Stockouts: 2-8% Revenue Lift
You can't sell what you don't have. Automated inventory management dramatically reduces stockouts.
Calculation:
Current stockout rate × Revenue × Recovery rate = Revenue gain
4% × $5,000,000 × 60% = $120,000
With automation, a business losing $200,000 annually to stockouts might recover $120,000 or more.
Faster Order Fulfillment: Improved Customer Satisfaction and Repeat Business
Speed matters. Every day faster you can fulfill orders:
- Improves customer satisfaction scores
- Increases repeat purchase rates
- Enables premium shipping options
- Differentiates from slower competitors
Impact: Companies that reduce fulfillment time by 50% typically see 10-15% improvement in repeat purchase rates.
Lower Shipping Costs: Route Optimization Saves 10-30%
Automated route planning optimizes for:
- Shortest distance
- Traffic patterns
- Delivery windows
- Vehicle capacity
- Driver hours
Typical savings: 15-25% reduction in fuel and driver costs.
Reduced Carrying Costs: Better Inventory Turnover
Excess inventory isn't free. Carrying costs typically run 20-30% of inventory value annually:
- Storage space
- Insurance
- Obsolescence
- Opportunity cost of tied-up capital
Impact: Automation that improves inventory turns from 4x to 6x annually frees 33% of inventory investment.
Fewer Expedite Fees: Proactive Alerts Prevent Emergencies
Rush shipping costs 2-3x standard rates. Automated exception alerts mean:
- Earlier visibility into potential delays
- Time to find alternatives before emergencies
- Proactive customer communication
- Fewer "emergency" situations overall
Impact: Companies typically reduce expedite shipping by 40-60% through better visibility.
Example: $5M Revenue Company Annual Savings
| Benefit Category | Conservative | Moderate | Aggressive |
|---|---|---|---|
| Stockout reduction | $60,000 | $100,000 | $150,000 |
| Fulfillment efficiency | $25,000 | $40,000 | $60,000 |
| Shipping optimization | $30,000 | $50,000 | $75,000 |
| Carrying cost reduction | $25,000 | $40,000 | $60,000 |
| Labor savings | $35,000 | $50,000 | $70,000 |
| Total Annual Benefit | $175,000 | $280,000 | $415,000 |
Even conservative estimates show $175,000+ annual benefit for a $5M business—a compelling ROI for most automation investments.
Key Automation Technologies
Understanding your technology options helps you make informed decisions:
Inventory Management Systems
Purpose: Track stock levels, movements, and valuations across locations.
Key features:
- Real-time quantity tracking
- Multi-location support
- Lot and serial number tracking
- Valuation methods (FIFO, LIFO, average)
- Reorder point management
- Reporting and analytics
Best for: Businesses outgrowing spreadsheets but not needing full WMS complexity.
Warehouse Management Systems (WMS)
Purpose: Optimize warehouse operations from receiving through shipping.
Key features:
- Receiving and put-away optimization
- Location management and slotting
- Pick path optimization
- Packing and shipping integration
- Labor management
- Cycle counting support
Best for: Warehouses with 5,000+ SKUs or complex operations.
For more details, see our guide on warehouse management systems for small business.
Transportation Management Systems (TMS)
Purpose: Plan, execute, and optimize freight movement.
Key features:
- Route optimization
- Carrier selection and rating
- Load planning
- Track and trace
- Freight audit and payment
- Performance analytics
Best for: Businesses with significant delivery operations or freight spend. Enterprise-grade TMS solutions like QuantumByte's custom TMS scale from regional operations to nationwide networks with thousands of vehicles.
Demand Planning Tools
Purpose: Forecast future demand to optimize inventory investment.
Key features:
- Historical analysis
- Statistical forecasting
- Promotional planning
- Seasonality modeling
- Collaborative forecasting
- Accuracy measurement
Best for: Businesses with seasonal patterns or promotional complexity.
Supplier Portals
Purpose: Streamline communication and collaboration with vendors.
Key features:
- PO transmission and acknowledgment
- Ship notice management
- Invoice submission
- Performance dashboards
- Document management
- Communication logging
Best for: Businesses with multiple active suppliers requiring coordination.
Real-Time Tracking and IoT Sensors
Purpose: Visibility into asset location and condition.
Key features:
- GPS tracking for vehicles and shipments
- Temperature and humidity monitoring
- Door open/close detection
- Impact and handling alerts
- Condition-based alerts
Best for: High-value shipments, cold chain, or sensitive goods.
| Technology | Complexity | Cost Range | Best For |
|---|---|---|---|
| Inventory Management | Low-Medium | $50-500/mo | Growing businesses |
| WMS | Medium-High | $500-5,000/mo | Complex warehouses |
| TMS | Medium-High | $200-2,000/mo | Delivery operations |
| Demand Planning | Medium | $200-1,000/mo | Seasonal/promotional businesses |
| Supplier Portal | Low-Medium | Custom build | Multi-supplier coordination |
| IoT/Tracking | Medium | $5-50/device/mo | High-value/sensitive goods |
Enterprise-Grade Supply Chain Automation: A Practical Approach
Traditional enterprise supply chain software costs six figures and takes a year to implement. But enterprises don't need to choose between expensive legacy systems and limited off-the-shelf tools. Modern custom solutions deliver enterprise-grade capabilities at a fraction of the cost and time.
Enterprise Capabilities Without Enterprise Complexity
The 80/20 rule applies: 80% of the benefit comes from 20% of the features. Enterprise-grade custom solutions start with:
- Custom dashboards and alerts: Real-time visibility into critical metrics across all locations
- Automated reorder triggers: Never manually check stock levels again, with multi-location support
- Supplier portals for self-service: Let vendors update their own information, reducing coordination overhead
- Mobile apps for warehouse teams: Eliminate paper and manual data entry across distributed operations
- Integration between existing systems: Connect what you have before buying new, preserving existing investments
Start with Custom Dashboards and Alerts
Before buying comprehensive software, build visibility:
- What inventory levels need attention?
- Which orders are at risk of delay?
- What shipments have exceptions?
- Which suppliers are underperforming?
A well-designed dashboard provides 80% of the value of complex systems at 10% of the cost.
Build Supplier Portals for Self-Service
Stop chasing suppliers for updates. Give them a portal to:
- Acknowledge purchase orders
- Update ship dates
- Submit advance ship notices
- Upload invoices
- View their performance scores
Self-service reduces your coordination burden while improving data accuracy.
Automate Reorder Points and PO Generation
Manual reorder monitoring doesn't scale. Automate:
- Reorder point calculation based on lead time and demand
- Safety stock adjustments for variability
- PO generation when thresholds trigger
- Approval routing for high-value orders
- Transmission to suppliers
This single automation often delivers the highest ROI.
Create Mobile Apps for Warehouse Teams
Paper-based warehouse processes create delays and errors. Mobile apps enable:
- Barcode scanning for receiving, picking, and shipping
- Real-time inventory updates
- Exception capture and communication
- Task assignment and completion tracking
- Performance visibility
Progressive Sophistication as You Grow
Start simple, add complexity as needed:
Stage 1: Dashboards and alerts (visibility) Stage 2: Automated reorders and POs (reactive automation) Stage 3: Demand forecasting (proactive planning) Stage 4: Optimization algorithms (advanced efficiency)
Don't jump to Stage 4 before mastering Stage 1.
Case Study: Avian Transport Management System
To illustrate supply chain automation at scale, let's examine how Avian transformed their nationwide distribution operations.
The Challenge
Avian, one of Indonesia's leading paint and coatings manufacturers, operates a massive distribution network:
- 142 branches across Indonesia
- 1,500 vehicles in the fleet
- 15,000+ daily orders to process
Despite this scale, each region managed deliveries independently with manual processes:
- Route planning done by hand or simple spreadsheets
- Dispatch based on experience rather than optimization
- Reporting compiled manually and delivered late
- No real-time visibility into delivery status
The results:
- Data silos between regions
- Inconsistent service quality
- Increasing empty miles
- Declining on-time delivery rates
- Teams firefighting rather than planning
The Solution
Avian implemented QuantumByte's Transport Management System (TMS) to unify operations:
Dynamic Route Optimization
- Real-time traffic data integration
- Capacity and load rule enforcement
- Multi-stop optimization
- Delivery window management
Auto-Dispatching
- Automatic assignment based on location, capacity, and constraints
- Load balancing across vehicles
- Real-time reassignment for changes
Live Tracking and Visibility
- Real-time ETA tracking
- Exception alerts for delays
- Proof of delivery capture
- Customer notifications
Performance Management
- SLA breach alerts before they happen
- Branch scorecards for accountability
- Standardized exception workflows
- Real-time cost-per-route visibility
The Impact
| Metric | Before | After |
|---|---|---|
| Operational Visibility | Fragmented by region | Unified nationwide |
| Daily Orders Managed | Manual coordination | 15,000+ automated |
| Empty Miles | High and increasing | Significantly reduced |
| On-Time Performance | Declining | Measurably improved |
| Dispatcher Role | Firefighting | Forecasting and planning |
| Cost Visibility | Delayed reports | Real-time per-route |
What used to require siloed teams and manual coordination now runs as one synchronized network. Dispatchers shifted from reactive problem-solving to proactive optimization.
For related examples, see how SiBerDes digitized rice stock management with 90% error reduction.
Implementation Roadmap
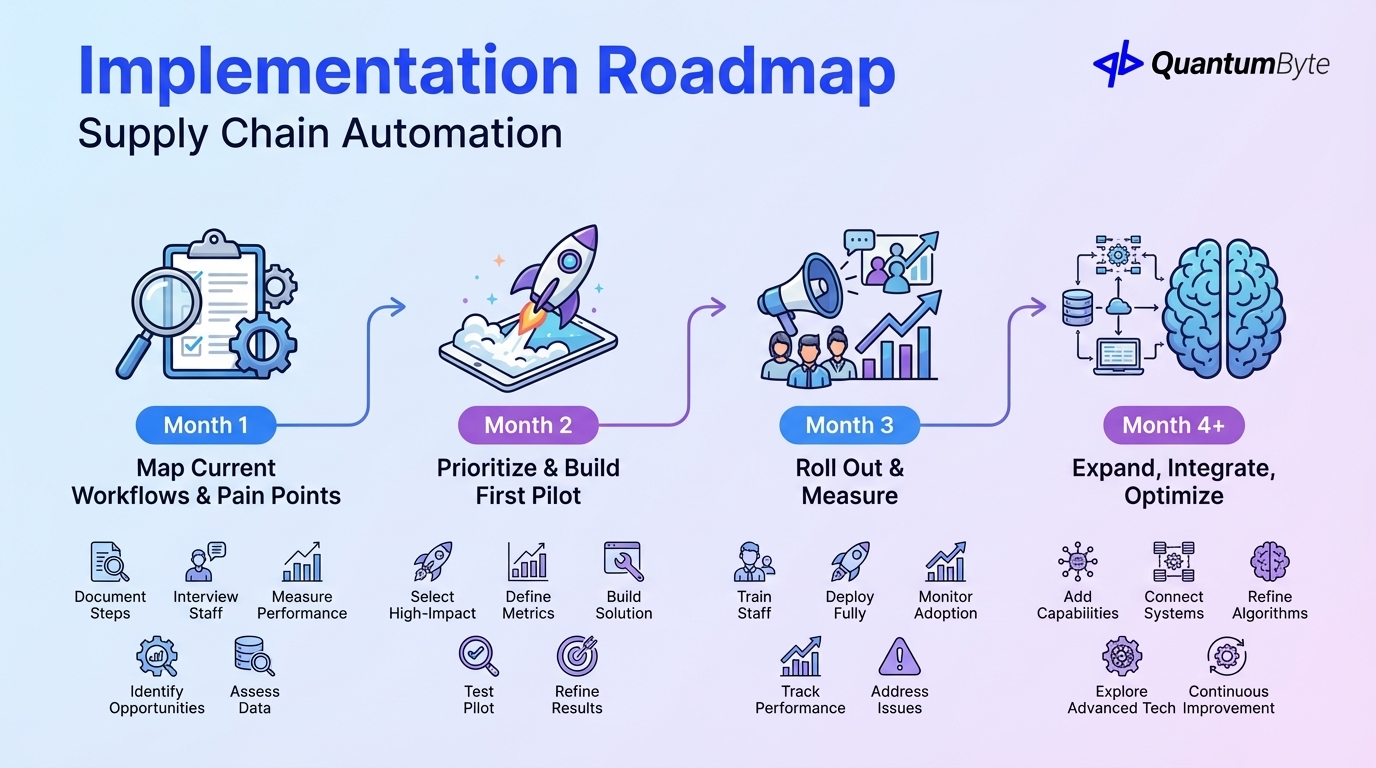
Successful supply chain automation follows a structured approach:
Month 1: Map Current Workflows and Identify Pain Points
Before automating, understand what you're automating.
Key activities:
- Document each supply chain process step-by-step
- Interview staff about pain points and workarounds
- Measure current performance (cycle times, error rates, costs)
- Identify the highest-impact opportunities
- Assess data quality and availability
Deliverable: Prioritized list of automation opportunities with baseline metrics.
Month 2: Prioritize Automations by ROI, Build First Pilot
Focus on quick wins that prove value.
Key activities:
- Select 1-2 high-impact, moderate-complexity processes
- Define success metrics and targets
- Build or configure automation solution
- Test with subset of data/operations
- Refine based on initial results
Deliverable: Working pilot automation with documented results.
Month 3: Roll Out to Broader Team, Measure Metrics
Expand successful pilots.
Key activities:
- Train all affected staff
- Deploy to full operation
- Monitor adoption and usage
- Track performance against baseline
- Address issues and resistance
Deliverable: Full deployment with measured improvement.
Month 4+: Expand Automation, Integrate Systems, Optimize
Build on success.
Key activities:
- Add additional automation capabilities
- Connect systems for end-to-end visibility
- Refine algorithms and rules based on data
- Explore advanced capabilities (forecasting, optimization)
- Continuous improvement based on metrics
Deliverable: Comprehensive, integrated supply chain automation.
How QuantumByte Develops Enterprise-Grade Supply Chain Solutions
Traditional supply chain software requires choosing between expensive legacy enterprise systems and limited off-the-shelf tools. QuantumByte offers enterprise-grade custom solutions that streamline your supply chain workflows—delivering the capabilities enterprises need without the complexity and cost of traditional implementations.
Custom TMS, WMS, and Inventory Solutions Built for Enterprise Scale
Describe your supply chain needs in natural language, and QuantumByte's AI generates enterprise-grade custom applications:
- Transportation management tailored to your routes, constraints, and multi-location operations
- Warehouse management matching your layout, processes, and scale requirements
- Inventory tracking with your specific requirements across distributed networks
These custom solutions deliver enterprise capabilities at a fraction of traditional enterprise software costs, starting at $468 a year versus $100,000+ for legacy systems.
AI-Powered Solution Generation from Your Process Descriptions
No need for lengthy requirements documents or technical specifications. Explain your enterprise needs:
- "I need to track inventory across multiple warehouses and distribution centers with automatic reorder when stock hits minimum levels"
- "I want drivers across our fleet to have a mobile app for route navigation and proof of delivery"
- "I need a supplier portal where vendors can confirm orders and update ship dates across our network"
QuantumByte's AI generates enterprise-grade applications from these descriptions, ready to scale with your operations.
Mobile-First for Warehouse and Driver Teams
Modern supply chains require mobility:
- Warehouse staff with scanning devices
- Drivers with route guidance and POD capture
- Managers with anywhere visibility
QuantumByte applications are mobile-native, not desktop-adapted.
Real-Time Dashboards and Alerts
Know what's happening now, not yesterday:
- Live inventory levels across locations
- Order status and exception alerts
- Delivery tracking and ETA updates
- Performance metrics and trends
API Integrations with Shipping Carriers and Accounting Systems
Enterprise supply chain automation must connect to:
- Carrier systems for rating and tracking
- Accounting software for cost capture
- E-commerce platforms for order import
- Supplier systems for PO transmission
- ERP systems for end-to-end visibility
QuantumByte provides pre-built integrations and custom API development to connect your entire technology stack.
Conclusion: Start Your Supply Chain Transformation
Supply chain efficiency directly impacts both costs and revenue. The businesses that automate strategically will:
- Capture sales competitors miss (fewer stockouts)
- Delight customers with speed and visibility
- Operate at lower costs (optimized routes, reduced labor)
- Free working capital (better inventory management)
- Scale without proportional overhead growth
The path forward is clear:
- Assess your current state: Where are you losing money?
- Prioritize opportunities: What delivers the highest ROI?
- Start with quick wins: Build momentum with visible results
- Expand systematically: Add capabilities as you prove value
- Integrate for visibility: Connect systems for end-to-end insight
Ready to transform your supply chain from cost center to competitive advantage? Schedule a consultation to explore your specific automation opportunities.
Other Guides to Explore
- Warehouse Management System for Small Business: Complete Guide
- Inventory Management Automation: Reduce Stockouts and Increase Sales
- Order Fulfillment Automation: Speed Up Delivery and Reduce Costs
- How to Automate Business Processes to Increase Revenue in 2025
- How to Calculate and Maximize Your Automation ROI
Frequently Asked Questions (FAQ)
How much does supply chain automation cost for enterprises?
Costs vary widely based on scope and approach. Basic inventory apps might cost $5,000-15,000. Comprehensive enterprise-grade TMS/WMS solutions range from $25,000-75,000 with AI-powered development like QuantumByte's custom solutions. Traditional legacy enterprise systems start at $100,000+. The key is calculating ROI—most enterprise-grade custom solutions pay back within 6-12 months while delivering capabilities that scale with your operations.
What's the difference between inventory management and warehouse management systems?
Inventory management focuses on what you have and where (quantities, locations, valuations). Warehouse management optimizes how you handle it (receiving, put-away, picking, packing, shipping). Small businesses often start with inventory management; warehouses with complex operations need WMS.
How long does supply chain automation take to implement?
Simple automations (alerts, basic tracking) can be live in weeks. Comprehensive systems typically take 2-4 months for full implementation. The phased approach—starting with high-impact, quick-win automations—delivers value faster while building toward comprehensive coverage.
Will supply chain automation eliminate jobs?
Automation changes jobs more than it eliminates them. Manual data entry disappears, but analytical and customer-facing roles grow. Most companies redeploy staff rather than reduce headcount, with employees moving to higher-value activities that automation enables.
What data do I need before implementing supply chain automation?
At minimum: current inventory levels, order history, supplier information, and process documentation. Better data enables better automation—historical demand for forecasting, carrier performance for routing, cost data for optimization. Start with what you have; improve data quality as you automate.
How do I convince my team to adopt new supply chain systems?
Start with their pain points—what frustrates them daily? Show how automation addresses those specific problems. Involve key users in selection and configuration. Celebrate early wins. Provide thorough training and ongoing support. Address concerns about job security directly.