You know automation saves time. But do you know how much it's actually worth to your business? Most companies dramatically underestimate automation's value—by 3-5x or more—because they only count the obvious benefits while ignoring the hidden value.
This comprehensive guide gives you the complete formula for calculating automation ROI, breaks down each component in detail, provides real-world examples across business types, and shares 8 proven strategies to maximize your returns. By the end, you'll be able to build a compelling business case for any automation investment.
Beyond "Saving Time"
Ask most business owners why they're considering automation, and they'll say "to save time." That's like saying you invest to "have more money". Technically true but dramatically undervalued.
The full process automation benefits include:
- Direct labor savings: Time your team doesn't spend on manual tasks
- Error cost reduction: Mistakes that don't happen, corrections you don't need
- Revenue growth acceleration: Faster cycles, higher conversion, better retention
- Opportunity value: What your team accomplishes with reclaimed capacity
- Scalability: Growth without proportional headcount increases
- Competitive positioning: Speed and quality advantages that win business
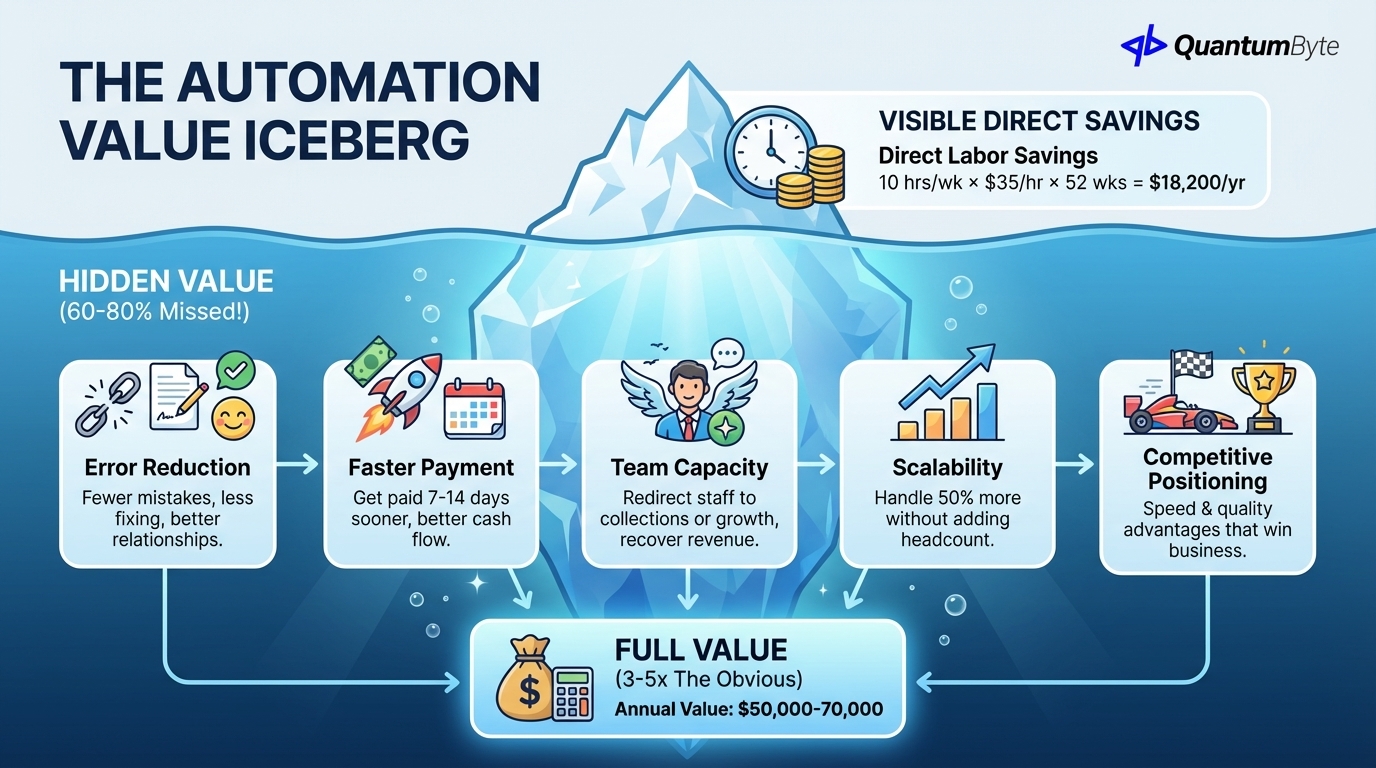
Most ROI calculations capture only the first item—direct labor savings. They miss 60-80% of the actual value.
Why Most Businesses Underestimate Automation Value by 3-5x
Consider an invoice processing automation. The obvious calculation:
10 hours saved per week × $35/hour × 52 weeks = $18,200/year
That's meaningful, but it misses:
- Error reduction: Fewer incorrect invoices = fewer customer complaints, less time fixing mistakes, better vendor relationships
- Faster payment: Getting paid 7-14 days sooner = improved cash flow = less borrowing or better investment
- Team capacity: AR staff redirected to collections or customer success = recovered revenue
- Scalability: Handling 50% more invoices without adding headcount = lower cost per transaction as you grow
The full value might be $50,000-70,000 annually—3-4x the obvious calculation.
The Complete Automation ROI Formula
Here's the comprehensive formula for calculating true automation value:
Annual ROI = (Direct Labor Savings + Error Cost Reduction + Revenue Growth Acceleration + Opportunity Value) - (Implementation Cost + Annual Maintenance)
Let's break down each component:
Component 1: Direct Labor Savings
The most straightforward calculation—hours saved multiplied by cost of those hours.
Formula:
Hours saved per week × Fully-loaded hourly cost × 52 weeks
Important considerations:
- Fully-loaded cost: Include salary, benefits, taxes, and overhead (typically 1.3-1.5x base salary)
- All participants: Count everyone involved in the process, not just the primary executor
- Hidden time: Include meeting time, coordination overhead, and context-switching costs
Example calculation:
| Role | Hours/Week on Process | Fully-Loaded Rate | Annual Cost |
|---|---|---|---|
| AP Clerk | 8 hrs | $35/hr | $14,560 |
| Manager (approvals) | 2 hrs | $60/hr | $6,240 |
| Accountant (reconciliation) | 3 hrs | $45/hr | $7,020 |
| Total | 13 hrs | $27,820 |
If automation reduces this process by 80%:
Annual Labor Savings = $27,820 × 80% = $22,256
Component 2: Error Cost Reduction
Manual processes generate errors. Errors cost money—sometimes far more than the direct labor involved.
Formula:
Current error rate × Tasks per year × Average cost per error × Reduction rate from automation
Quantifying error rates:
Typical manual process error rates:
- Data entry: 1-4% error rate
- Complex calculations: 3-8% error rate
- Multi-step processes: 5-15% error rate
Quantifying error costs:
Each error generates costs:
- Detection time: Finding the error
- Investigation time: Understanding what went wrong
- Correction time: Fixing the error
- Downstream impact: Customer complaints, delayed decisions, relationship damage
- Regulatory risk: Compliance violations, fines
The Global Business Travel Association found invoice errors cost an average of $52 each to resolve.
Example calculation:
| Factor | Value |
|---|---|
| Tasks per year | 5,000 invoices |
| Current error rate | 3% |
| Errors per year | 150 |
| Cost per error | $53 |
| Annual error cost | $7,950 |
| Automation reduction | 95% |
| Annual Savings | $7,553 |
Automation typically reduces errors by 90-99%—machines don't make typos or get distracted.
Component 3: Revenue Growth Acceleration
Automation doesn't just cut costs—it accelerates revenue generation. This is where many ROI calculations fall short.
Faster quote-to-close cycles (sales automation):
Every day shaved from your sales cycle is revenue realized sooner. If your average deal is $10,000 and your sales cycle is 60 days, reducing it to 45 days means:
- Cash in hand 15 days sooner
- More capacity for additional deals
- Compound effect across all deals
Reduced stockouts (inventory automation):
You can't sell what you don't have. Inventory automation that reduces stockouts by even 2% translates directly to captured revenue that would otherwise be lost.
Formula:
Annual revenue × Stockout rate × Reduction from automation = Revenue recovered
$5,000,000 × 4% × 50% = $100,000
Improved customer satisfaction → retention → lifetime value:
Faster service, fewer errors, and better communication improve customer experience. According to Bain & Company, a 5% increase in customer retention can increase profits by 25-95%.
Faster fulfillment → conversion:
In e-commerce, every day faster you can fulfill orders improves conversion by 5-8%. Automation that reduces fulfillment time from 5 days to 2 days could improve conversion by 15-24%.
Example calculation:
A company with $5M revenue implements sales automation:
| Factor | Calculation | Value |
|---|---|---|
| Sales cycle reduction | 60 → 45 days (25% faster) | |
| Additional deal capacity | 25% more deals/year | |
| Average deal value | $15,000 | |
| Additional deals closed | 10 deals | $150,000 |
| Improved win rate (faster response) | 5% improvement | $50,000 |
| Revenue Acceleration Value | $200,000 |
Component 4: Opportunity Value
What could your team accomplish with 20 hours per week back? This is the hardest to quantify but often the most valuable component.
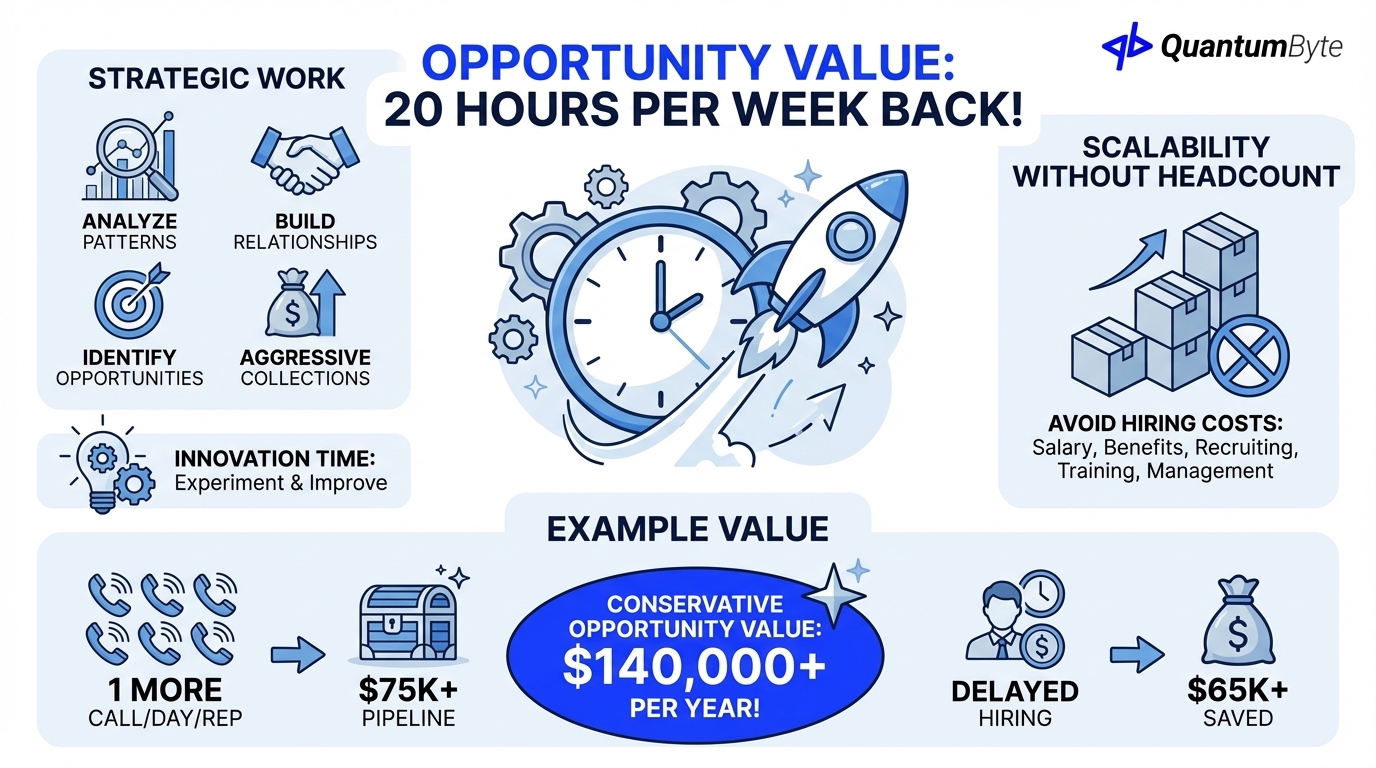
Strategic work vs. tactical busywork:
When your clerk isn't processing invoices, they can focus on:
- Analyzing payment patterns to optimize terms
- Building relationships with key customers
- Identifying accounts at risk
- Pursuing collections more aggressively
When your sales rep isn't doing data entry, they can:
- Make more prospect calls
- Spend more time with customers
- Research and prepare for key accounts
- Mentor junior team members
Innovation time:
Automation frees capacity for experimentation and improvement. The team that's drowning in manual work can't improve processes—they're too busy executing them.
Scalability without headcount:
Perhaps most valuable: automation lets you grow without proportional hiring. If you can handle 50% more volume without adding staff, you've avoided:
- Salary and benefits for new hires
- Recruiting costs
- Training time
- Management overhead
Example calculation:
| Opportunity | Value |
|---|---|
| 1 additional sales call/day/rep (5 reps) | $75,000/year in pipeline |
| Delayed hiring of 1 staff member | $65,000/year |
| Process improvement time (10 hrs/week) | Hard to quantify, high value |
| Conservative Opportunity Value | $140,000 |
Implementation and Maintenance Costs
ROI requires accounting for costs:
Cost Comparison
Compared to alternatives, AI-powered development significantly reduces costs:
| Approach | Implementation | Annual Maintenance | 5-Year TCO |
|---|---|---|---|
| Traditional Agency | $100,000 | $15,000 | $175,000 |
| Freelance Developer | $50,000 | $10,000 | $100,000 |
| SaaS Platform | $5,000 | $24,000 | $125,000 |
| QuantumByte | free to start | $468 onwards | $2,340 |
That's a massive cost reduction from AI-powered development which dramatically improves automation ROI calculations.
Real ROI Examples Across Business Types
Theory becomes convincing with concrete examples. Here are detailed calculations for three business types:
Example 1: 50-Person Professional Services Firm
Profile: Consulting firm with $8M revenue, 15 consultants, back-office staff.
Automation Focus: Time tracking, invoicing, expense management, client reporting.
| Benefit Category | Annual Value |
|---|---|
| Direct Labor Savings | |
| Time tracking automation | $18,000 |
| Invoice generation | $12,000 |
| Expense processing | $15,000 |
| Report automation | $24,000 |
| Subtotal | $69,000 |
| Error Cost Reduction | |
| Billing accuracy | $8,000 |
| Expense compliance | $5,000 |
| Subtotal | $13,000 |
| Revenue Acceleration | |
| Faster invoicing (5 days earlier) | $32,000 (improved cash flow) |
| More billable hours (admin reduction) | $48,000 |
| Subtotal | $80,000 |
| Opportunity Value | |
| Consultant time on clients | $18,000 |
| Subtotal | $18,000 |
| Gross Annual Benefit | $180,000 |
| Less: Annual Costs | ($12,000) |
| Net Annual ROI | $168,000 |
| Implementation Cost | $35,000 |
| Payback Period | 2.5 months |
Example 2: 20-Person Manufacturing Company
Profile: Custom manufacturing with $3M revenue, complex quoting and order management.
Automation Focus: Quote generation, order tracking, inventory management, shipping.
| Benefit Category | Annual Value |
|---|---|
| Direct Labor Savings | |
| Quote automation | $22,000 |
| Order entry | $15,000 |
| Inventory tracking | $18,000 |
| Subtotal | $55,000 |
| Error Cost Reduction | |
| Quote accuracy | $12,000 |
| Order errors | $8,000 |
| Inventory discrepancies | $6,000 |
| Subtotal | $26,000 |
| Revenue Acceleration | |
| Faster quote turnaround | $15,000 (won deals) |
| Reduced stockouts | $18,000 |
| Subtotal | $33,000 |
| Opportunity Value | |
| Sales focus (less admin) | $10,000 |
| Subtotal | $10,000 |
| Gross Annual Benefit | $124,000 |
| Less: Annual Costs | ($8,000) |
| Net Annual ROI | $116,000 |
| Implementation Cost | $25,000 |
| Payback Period | 2.6 months |
Example 3: 10-Person SaaS Startup
Profile: B2B SaaS with $1.5M ARR, growth-focused, lean team.
Automation Focus: Lead management, onboarding, support ticketing, billing.
| Benefit Category | Annual Value |
|---|---|
| Direct Labor Savings | |
| Lead routing/follow-up | $12,000 |
| Customer onboarding | $8,000 |
| Support triage | $10,000 |
| Subtotal | $30,000 |
| Error Cost Reduction | |
| Lead attribution | $3,000 |
| Billing accuracy | $5,000 |
| Subtotal | $8,000 |
| Revenue Acceleration | |
| Faster lead response | $25,000 (conversion improvement) |
| Improved onboarding (retention) | $15,000 |
| Subtotal | $40,000 |
| Opportunity Value | |
| Delayed hire (support) | $55,000 |
| Subtotal | $55,000 |
| Gross Annual Benefit | $133,000 |
| Less: Annual Costs | ($6,000) |
| Net Annual ROI | $127,000 |
| Implementation Cost | $20,000 |
| Payback Period | 1.9 months |
These examples demonstrate that automation ROI is substantial across business types, with typical payback periods of 2-4 months.
Maximizing Your ROI: 8 Proven Strategies
Calculating ROI is only half the battle. These strategies ensure you capture the maximum value:
Strategy 1: Start with Highest-Impact, Lowest-Complexity Processes
The ideal first automation target scores high on impact and low on complexity:
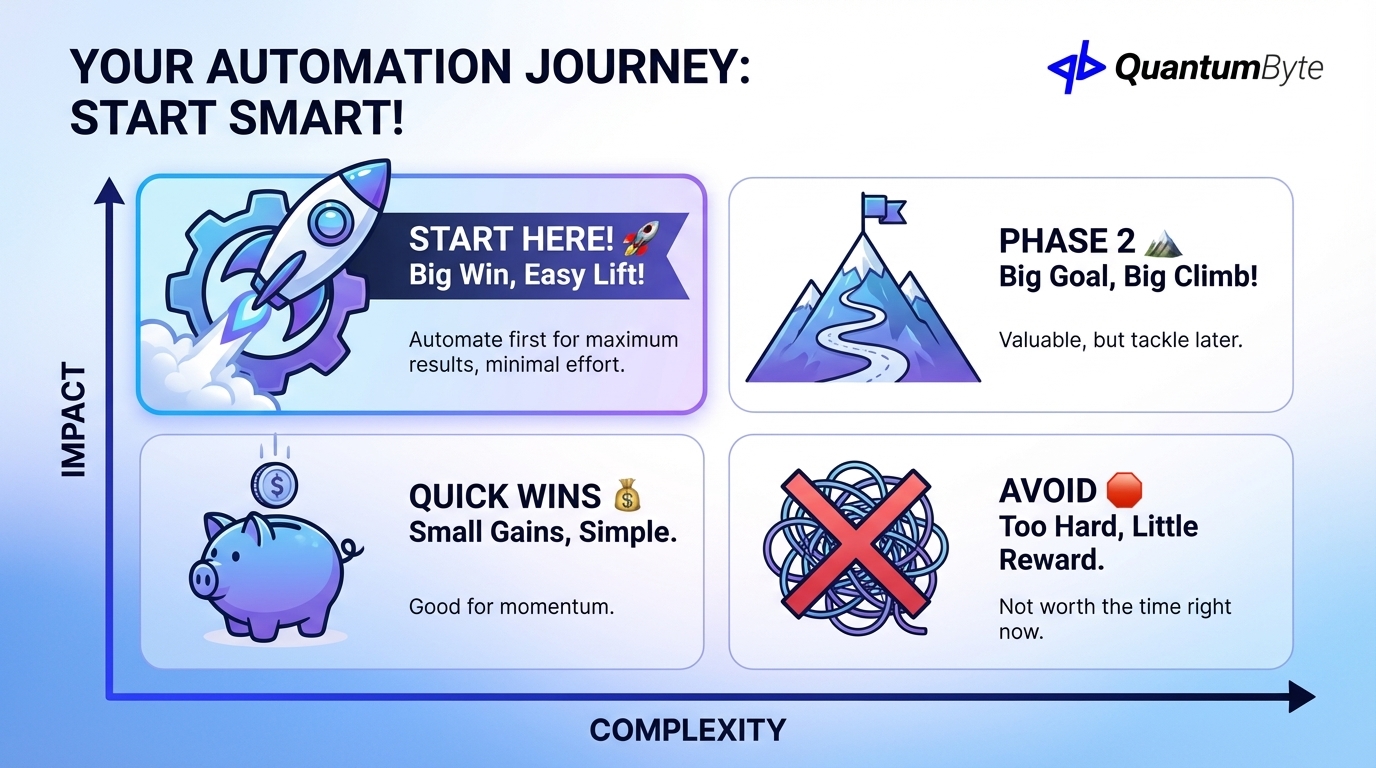
High-impact indicators:
- Large time investment currently
- High error rate with costly corrections
- Clear connection to revenue
- Multiple people involved
Low-complexity indicators:
- Well-defined, consistent process
- Few exceptions or edge cases
- Available integration points
- Supportive stakeholders
Strategy 2: Automate in Phases to Spread Cost and Learn
Don't try to automate everything at once. Phased implementation:
- Spreads investment over time (better cash flow)
- Generates early wins that build momentum
- Provides learning for subsequent phases
- Reduces organizational change fatigue
- Allows course correction based on results
Recommended approach:
- Phase 1: One high-impact process (prove value)
- Phase 2: 2-3 related processes (expand success)
- Phase 3: Full department automation
- Phase 4: Cross-department integration
Strategy 3: Measure Baseline Metrics Before Implementation
You can't prove ROI without knowing where you started. Before automating any process:
- Document current time investment (track for 2-4 weeks)
- Measure error rates (audit a sample of recent work)
- Calculate current costs using formulas above
- Note qualitative pain points for later comparison
Without baseline metrics, you're guessing at improvement. With them, you can prove value definitively.
Strategy 4: Train Power Users to Drive Adoption
Automation that people don't use delivers no value. Identify and empower power users:
- Early adopters who are excited about new tools
- Opinion leaders whose endorsement influences others
- Heavy users who will see the most benefit
Invest extra training time with these individuals. Their success and advocacy will drive broader adoption.
Strategy 5: Build Feedback Loops for Continuous Improvement
Automation isn't "set and forget." Build in mechanisms for ongoing optimization:
- Regular metrics review (monthly or quarterly)
- User feedback collection (what's working, what's frustrating)
- Exception tracking (where does automation break down?)
- Enhancement prioritization (what would add the most value?)
The best automation implementations improve continuously based on real-world feedback.
Strategy 6: Stack Automations (One Feeds Into Another)
Individual automations are valuable. Connected automations are transformational.
Example automation stack:
- Lead captured from website → automatically scored and routed
- Sales rep receives notification → automated meeting scheduling
- Meeting completed → automated follow-up sequence starts
- Deal closed → automated onboarding workflow triggers
- Onboarding complete → automated check-in schedule begins
Each automation multiplies the value of others. A stack like this might replace 20+ hours of manual coordination per customer.
Strategy 7: Leverage AI to Reduce Customization Costs
Traditional custom automation is expensive because every unique requirement requires custom development. AI-powered platforms like QuantumByte change this equation:
- Describe requirements in natural language
- AI generates custom logic without coding
- Iterate quickly based on results
- Add complexity incrementally
For more on this approach, see our article on AI app builders explained.
Strategy 8: Partner with a Development Team for Complex Needs
Some automation exceeds what off-the-shelf or simple AI-generated solutions can handle. For complex requirements:
- Multi-system integration
- Sophisticated business logic
- High-volume performance requirements
- Regulatory compliance needs
A development partnership ensures complex automation is built right the first time, avoiding costly rework.
Case Study: Telkomsel Competency Mapping
To illustrate maximum ROI achievement through strategic automation, let's examine Telkomsel's HR transformation.
The Challenge
Telkomsel, Indonesia's largest telecommunications provider, faced a massive competency mapping challenge:
- 19,000 job positions to map to official competency catalogues
- 25-30 working days required for the manual process
- Inconsistent interpretations across departments
- Difficult audit preparation due to off-catalogue assignments
- Restructuring alignment complicated by manual process limitations
The Solution
Using QuantumByte's AI-understanding layer, Telkomsel automated:
- Job title parsing with natural language understanding
- Rule-based constraints by department and level
- Catalogue-only retrieval with confidence and reason codes
- Excel-friendly workflows for batch review
- Validation automation ensuring consistency
The ROI
| Metric | Before | After | Value |
|---|---|---|---|
| Processing Time | 25-30 days | 3-5 days | 85% reduction |
| Manual Hours | ~2,000 hrs | ~200 hrs | 1,800 hrs saved |
| Accuracy | Variable | Near-perfect | Rework eliminated |
| Audit Readiness | Days | Immediate | Risk reduction |
ROI Calculation:
| Benefit | Annual Value |
|---|---|
| Direct labor savings (1,800 hrs × $40) | $72,000 |
| Rework elimination | $25,000 |
| Faster restructuring execution | $100,000+ (strategic value) |
| Audit preparation reduction | $15,000 |
| Total Annual Benefit | $212,000+ |
Implementation cost recovery: Under 2 months.
This case demonstrates how strategic automation—targeting high-volume, error-prone processes—delivers ROI that justifies significant investment.
QuantumByte ROI Advantage
QuantumByte's approach specifically maximizes automation ROI through:
5x Faster Implementation = Faster Payback
Traditional custom app development takes 6-12 months. QuantumByte projects typically complete in 1-8 weeks. Faster implementation means:
- Benefits start accruing sooner
- Shorter payback periods
- Lower implementation risk
- Faster iteration to optimize
AI Reduces Development Cost drastically
The AI-first approach generates most of the code automatically, dramatically reducing development costs. Lower costs mean:
- More automation projects become viable
- ROI calculations improve significantly
- Budget stretches further
- Smaller businesses can access sophisticated automation via custom apps
No Vendor Lock-In = No Switching Costs
Proprietary platforms create hidden costs: if you want to switch vendors or bring development in-house, migration can cost as much as the original implementation. QuantumByte provides:
- Full source code ownership
- Standard technology stack
- Deploy anywhere capability
- No proprietary dependencies
This eliminates switching costs from ROI calculations entirely.
Full Dev Team = No Expensive Consultants
When you need human expertise for complex requirements, QuantumByte provides integrated development support—not expensive consulting firms. This keeps costs predictable and expertise accessible.
Conclusion: Start Your ROI Calculation Today
Process automation benefits extend far beyond the obvious time savings. When you account for:
- Direct labor savings
- Error cost reduction
- Revenue growth acceleration
- Opportunity value
- Scalability benefits
The true ROI of automation typically exceeds initial estimates by 3-5x.
Your next steps:
- Identify your first target process using the high-impact/low-complexity framework
- Measure baseline metrics for 2-4 weeks
- Calculate full ROI using the comprehensive formula
- Evaluate implementation approaches based on your requirements
- Start with a pilot to prove value before scaling
The businesses that automate strategically today will capture compounding advantages for years to come. The question isn't whether automation provides ROI—it's how much value you're leaving on the table by waiting.
Ready to calculate the ROI for your specific automation opportunities? Schedule a consultation to get a detailed analysis of your potential returns.
Other Guides to Explore
- How to Automate Business Processes to Increase Revenue in 2025
- Workflow Automation Software: How to Reduce Costs and Boost Revenue
- Custom Business Software Development: When to Build vs. Buy
- Supply Chain Automation: How to Reduce Costs and Increase Revenue
- Invoice Automation: How to Get Paid Faster and Reduce Costs
Frequently Asked Questions (FAQ)
How do I calculate automation ROI if I can't measure everything?
Start with what you can measure—time savings and error rates are usually trackable. For harder-to-quantify benefits like opportunity value, use conservative estimates. Even partial ROI calculations typically justify automation investment; full calculations just strengthen the case.
What's a good ROI target for automation projects?
Most successful automation projects achieve 200-500% ROI in the first year, with payback periods of 2-6 months. Projects with lower expected ROI (under 100% first-year return) should be scrutinized carefully or combined with other initiatives.
Should I include soft benefits in my ROI calculation?
Yes, but label them clearly. Hard benefits (time savings, error reduction) should drive the core calculation. Soft benefits (employee satisfaction, competitive positioning) can support the case but shouldn't be the primary justification. Decision-makers appreciate honesty about what's quantifiable.
How does automation ROI change as we scale?
Automation ROI typically improves with scale. Fixed implementation costs spread over more transactions, and manual processes that were acceptable at low volume become bottlenecks at high volume. The difference between manual and automated cost-per-transaction widens as volume increases.
What if our automation doesn't achieve projected ROI?
Investigate systematically: Is adoption low? Are there process issues the automation didn't address? Did requirements change? Is measurement accurate? Most ROI shortfalls trace to adoption problems (training, change management) rather than technology issues. Address the root cause rather than abandoning automation.
How often should we recalculate automation ROI?
Review ROI annually at minimum. Automation value can change due to: volume changes (more transactions = more savings), cost changes (wage increases make savings worth more), new capabilities (enhancements add value), or business changes (processes evolve). Regular review ensures you're capturing full value and identifies optimization opportunities.
Is there such a thing as too much automation?
Yes. Automating low-value processes wastes implementation resources. Automating unstable processes creates technical debt when they change. Automating human judgment tasks often produces poor outcomes. Focus automation on high-volume, stable, rule-based processes where the ROI calculation is clearly positive.