Inventory management is a Goldilocks problem: too much inventory ties up capital and risks obsolescence; too little means stockouts and lost sales. Most businesses oscillate between these extremes, never finding "just right."
Inventory management automation solves this problem systematically. By replacing manual tracking and gut-feel ordering with real-time data and intelligent triggers, you can optimize inventory levels, reduce stockouts, and free working.
This guide shows you exactly how to automate inventory management, from basic tracking to advanced forecasting, with practical implementation guidance and ROI calculations.
The Inventory Goldilocks Problem
Every dollar invested in inventory could be invested elsewhere. Every stockout is a sale you didn't make. Finding the balance requires:
- Perfect information: Knowing exactly what you have, where it is, and how fast it's moving
- Accurate forecasting: Predicting what you'll need before you need it
- Fast response: Reacting to changes before they become problems
- Systematic execution: Consistent processes that don't depend on individual heroics
Manual inventory management can't deliver on any of these at scale. Spreadsheets lag reality. Gut feelings miss patterns. Human attention can't monitor everything simultaneously.
The True Cost of Inventory Mismanagement
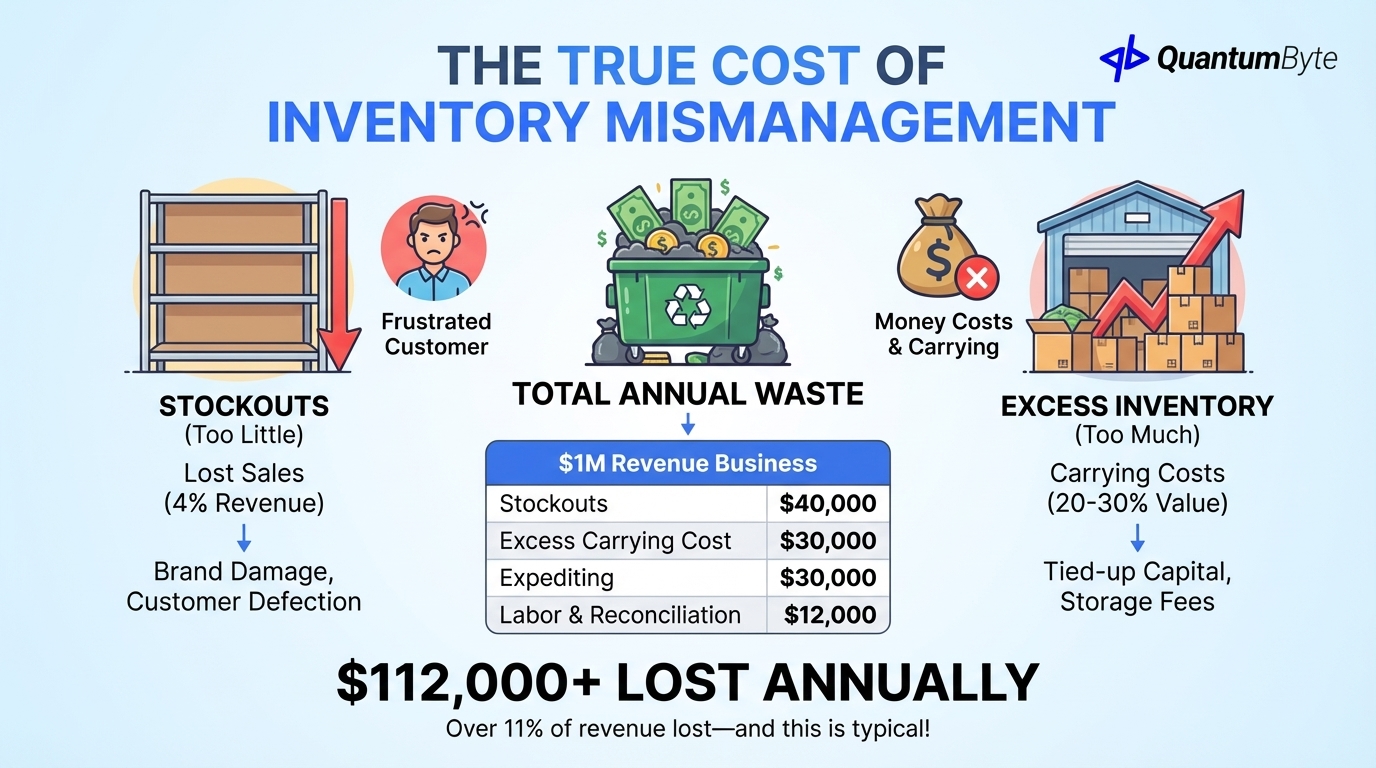
Both inventory extremes are expensive:
Cost of Stockouts:
- Trust Payments estimates stockouts cost retailers 4% of annual revenue on average
- Walden University reports customer defection and brand damage compound the impact
Cost of Excess Inventory:
- Investopedia notes carrying costs typically run 20-30% of inventory value annually
- Capital tied up in inventory can't fund growth
- Storage costs multiply with excess quantities
Example: $1M Revenue Business
| Problem | Typical Rate | Annual Cost |
|---|---|---|
| Stockouts (lost sales) | 4% of revenue | $40,000 |
| Excess inventory carrying cost | 25% of excess | $30,000 |
| Expediting for emergencies | 3% of revenue | $30,000 |
| Count labor and reconciliation | 20 hrs/month | $12,000 |
| Total Annual Waste | $112,000 |
Over 11% of revenue lost to inventory mismanagement, and this is typical, not worst-case.
8 Inventory Processes to Automate
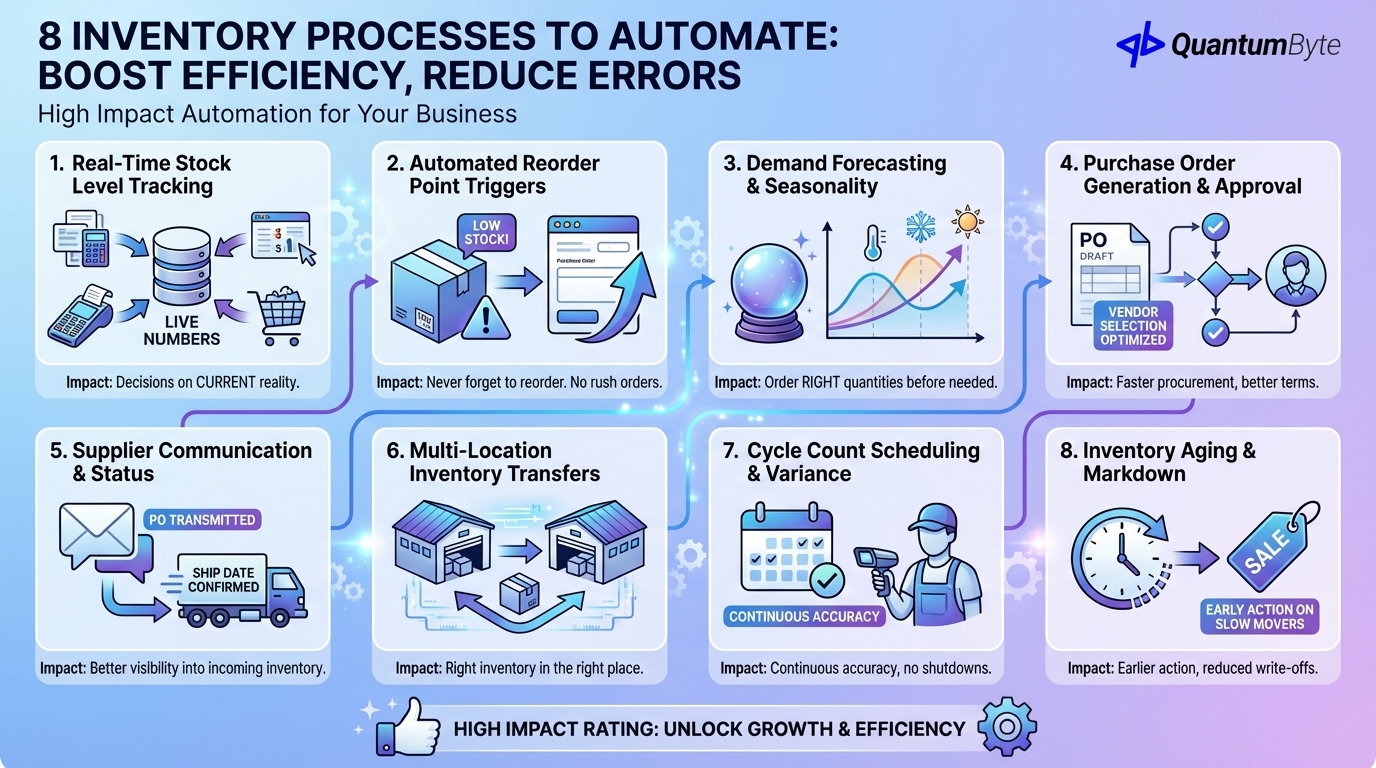
These processes deliver the highest impact when automated:
1. Real-Time Stock Level Tracking
The foundation: always knowing exactly what you have.
What to automate: Transaction capture at every movement, automatic updates from POS/e-commerce, real-time aggregation across locations, instant query access.
Impact: Decisions based on current reality, not stale data.
2. Automated Reorder Point Triggers
Stop manually checking stock levels and remembering to reorder.
What to automate: Reorder point calculation based on demand and lead time, automatic alerts, PO draft generation, approval workflow routing.
Impact: Never forget to reorder. Never rush-order because you waited too long.
3. Demand Forecasting and Seasonality Adjustment
Move beyond "last year plus 10%" using statistical forecasting methods.
What to automate: Historical demand pattern analysis, seasonality detection, trend identification, promotional impact adjustment.
Impact: Order the right quantities before you need them.
4. Purchase Order Generation and Approval
Eliminate manual PO creation and routing.
What to automate: PO creation from reorder triggers, vendor selection based on performance, quantity optimization, approval routing, automatic transmission.
Impact: Faster procurement cycle. Better vendor terms.
5. Supplier Communication and Order Status
Stop chasing vendors for updates.
What to automate: PO transmission with acknowledgment tracking, ship date confirmation, advance ship notice capture, exception alerts.
Impact: Better visibility into incoming inventory.
6. Multi-Location Inventory Transfers
Optimize stock across your network.
What to automate: Cross-location visibility, transfer recommendations, document generation, in-transit tracking.
Impact: Right inventory in right place. Fewer location-specific stockouts.
7. Cycle Count Scheduling and Variance Alerts
Maintain accuracy without disruptive full counts using ABC analysis.
What to automate: Count schedule generation, task assignment, variance calculation, investigation workflow.
Impact: Continuous accuracy improvement. No operational shutdowns.
8. Inventory Aging and Markdown Recommendations
Don't let inventory become obsolete.
What to automate: Days-on-hand tracking, aging category assignment, markdown triggers, write-off workflow.
Impact: Earlier action on slow movers. Reduced write-offs.
ROI Calculation Template
Quantify your inventory management automation opportunity:
Step 1: Calculate Current Stockout Cost
Annual revenue × Stockout rate × Capture rate = Recoverable revenue
$2,000,000 × 4% × 70% = $56,000
Step 2: Calculate Carrying Cost Reduction
Excess inventory value × Carrying cost rate × Reduction rate = Savings
$200,000 × 25% × 40% = $20,000
Step 3: Calculate Labor Savings
Hours per week × Hourly cost × 52 weeks × Reduction rate = Savings
15 hours × $30 × 52 × 70% = $16,380
Example: 20-Product SKU Business with $500K Inventory
| Benefit Category | Calculation | Annual Value |
|---|---|---|
| Stockout reduction | $500K revenue × 4% × 75% | $15,000 |
| Carrying cost reduction | $100K excess × 25% × 50% | $12,500 |
| Labor savings | 12 hrs/wk × $28 × 52 × 60% | $10,483 |
| Cash flow improvement | $75K freed × 12% | $9,000 |
| Total Annual Benefit | $46,983 | |
| Implementation Cost | $15,000-25,000 | |
| Payback Period | 4-6 months |
Implementation Strategy
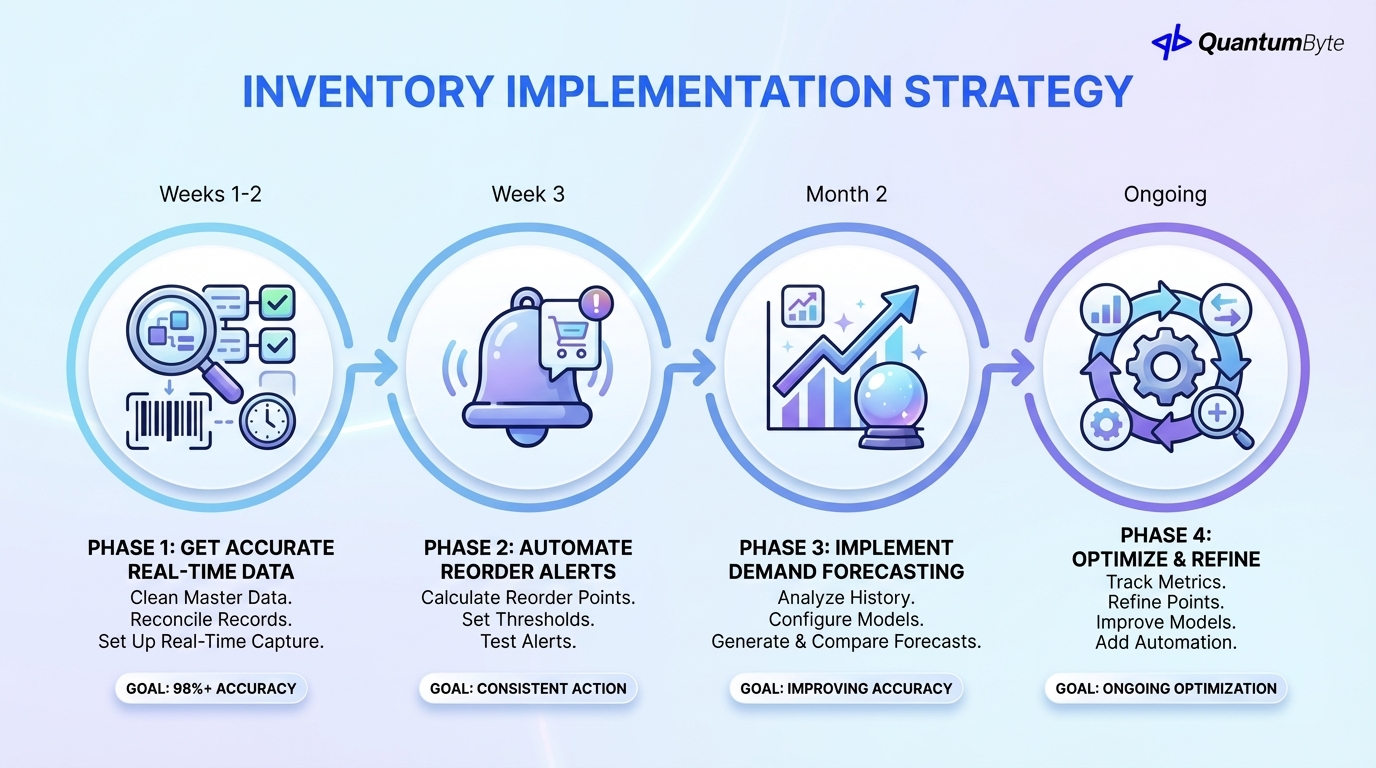
Success comes from systematic implementation:
Phase 1: Get Accurate Real-Time Inventory Data (Week 1-2)
Everything depends on data accuracy. Complete physical count, reconcile records, clean up item master, set up real-time transaction capture.
Success criteria: 98%+ inventory accuracy confirmed by cycle counts.
Phase 2: Set Up Automated Reorder Alerts (Week 3)
Start with simple alerts before complex automation. Calculate reorder points, configure thresholds, set up notifications, test with sample scenarios.
Success criteria: Alerts triggering appropriately, team acting consistently.
Phase 3: Implement Demand Forecasting (Month 2)
Add intelligence once basics are working. Analyze historical patterns, configure forecasting model, generate and compare forecasts.
Success criteria: Forecast accuracy improving month over month.
Phase 4: Optimize and Refine (Ongoing)
Track key metrics (accuracy, stockouts, turns, carrying cost). Refine reorder points. Improve forecast models. Add automation capabilities as needed.
QuantumByte Develops Inventory Apps That Streamline Your Workflows
QuantumByte develops custom inventory management automation apps that streamline your workflows:
Build What You Need, No Excess
Off-the-shelf systems include features you'll never use. Custom inventory management automation includes:
- Only the features you need today
- Architecture to add capabilities tomorrow
- No per-user or per-feature pricing
- Your processes, not generic workflows
Connect to Your Existing Systems
Inventory management automation must integrate with:
- E-commerce platforms (Shopify, WooCommerce)
- Point of sale systems
- Accounting software (QuickBooks, Xero)
- Shipping and fulfillment
Mobile Apps for Warehouse Teams
- Mobile-first design for scanning and tracking
- Offline capability for spotty connectivity
- Fast, responsive interface for real-time use
AI-Powered Forecasting Optional
Start simple, add sophistication as needed:
- Phase 1: Historical average-based reorder points
- Phase 2: Seasonal adjustment
- Phase 3: AI-powered demand forecasting
Conclusion: Take Control of Your Inventory
Inventory management automation transforms a constant struggle into a systematic advantage:
- Reduce stockouts by 60-80%: Capture sales you're currently losing
- Improve inventory turns by 30-50%: Free capital for growth
- Cut labor costs by 50-70%: Automate manual tracking and ordering
- Enable better decisions: Real-time data instead of guesswork
The technology is accessible. The ROI is clear. The only question is how long you'll continue accepting the cost of manual inventory management.
Ready to transform your inventory management? Schedule a consultation to explore your specific automation opportunities.
Other Guides to Explore
- Supply Chain Automation: How to Reduce Costs and Increase Revenue
- Warehouse Management System for Small Business: Complete Guide
- Order Fulfillment Automation: Speed Up Delivery and Reduce Costs
- How to Calculate and Maximize Your Automation ROI
Frequently Asked Questions (FAQ)
How accurate does my inventory need to be before automating?
You don't need perfect accuracy to start—but you need a clean baseline. Complete a full physical count, reconcile with your records, and achieve 95%+ accuracy before implementing automation. Automation maintains and improves accuracy; it can't fix a fundamentally broken starting point.
What's the difference between inventory management and warehouse management?
Inventory management focuses on what you have (quantities, values, reorder points). Warehouse management focuses on where it is and how you handle it (locations, picking paths, labor management). Small businesses often start with inventory management; warehouse management becomes important as operations grow.
How long does demand forecasting take to become accurate?
Basic pattern recognition can work within 2-3 months of historical data. Seasonal patterns require at least 12-18 months to detect reliably. AI-powered forecasting improves continuously as more data accumulates.
What ROI should I expect from inventory management automation?
Most implementations achieve 100-300% first-year ROI, with payback periods of 3-6 months. The primary drivers are stockout reduction (revenue recovery) and carrying cost reduction (capital efficiency).
How do I handle inventory automation for multiple sales channels?
Multi-channel inventory requires real-time synchronization to prevent overselling. The system of record must aggregate all channels and update availability instantly. This is a key reason to move beyond spreadsheets—manual multi-channel management is nearly impossible at scale.