
Manual financial reporting is a serious bottleneck. In many teams, most of the "work" is still collecting exports, cleaning columns, and chasing missing tags instead of explaining what the numbers mean.
Automated P&L reporting flips that. Instead of rebuilding your income statement every week (or every month), you connect directly to your general ledger and create a system that refreshes on schedule, slices by department or project, and flags problems automatically.
This guide walks you through the technical steps: connecting your ERP, mapping your accounts, adding dimensions, syncing on schedule, and layering in variance analysis and exception flags. If you are new to finance automation, start with our overview on accounting process automation.
If you want help turning this into a working app fast, Quantum Byte can build the workflow with you.
Why Automated P&L Reporting Is Essential for Modern Finance
Spreadsheets are powerful, but they are fragile at scale. One classic research review on spreadsheet risk found that spreadsheet errors are extremely common in real-world models, especially as complexity rises. That matters because a P&L is not a one-off model. It is a repeating operational process.
Automation helps you in three big ways:
- Faster close: You stop waiting on exports, manual merges, and last-minute "what changed?" checks.
- Higher confidence: You reduce copy-paste work and formula drift, and you build one repeatable set of rules.
- Better decisions mid-month: You can move toward continuous accounting, where leaders check performance while it is still actionable.
If you are a business owner, this is the real win: you spend less time debating whether the numbers are correct, and more time using them to steer. For a deeper dive on the financial benefits, see our guide on calculating finance automation ROI.
How to Set Up Automated P&L Reporting: A Step-by-Step Guide
Step 1: Connect Your ERP or Accounting Software
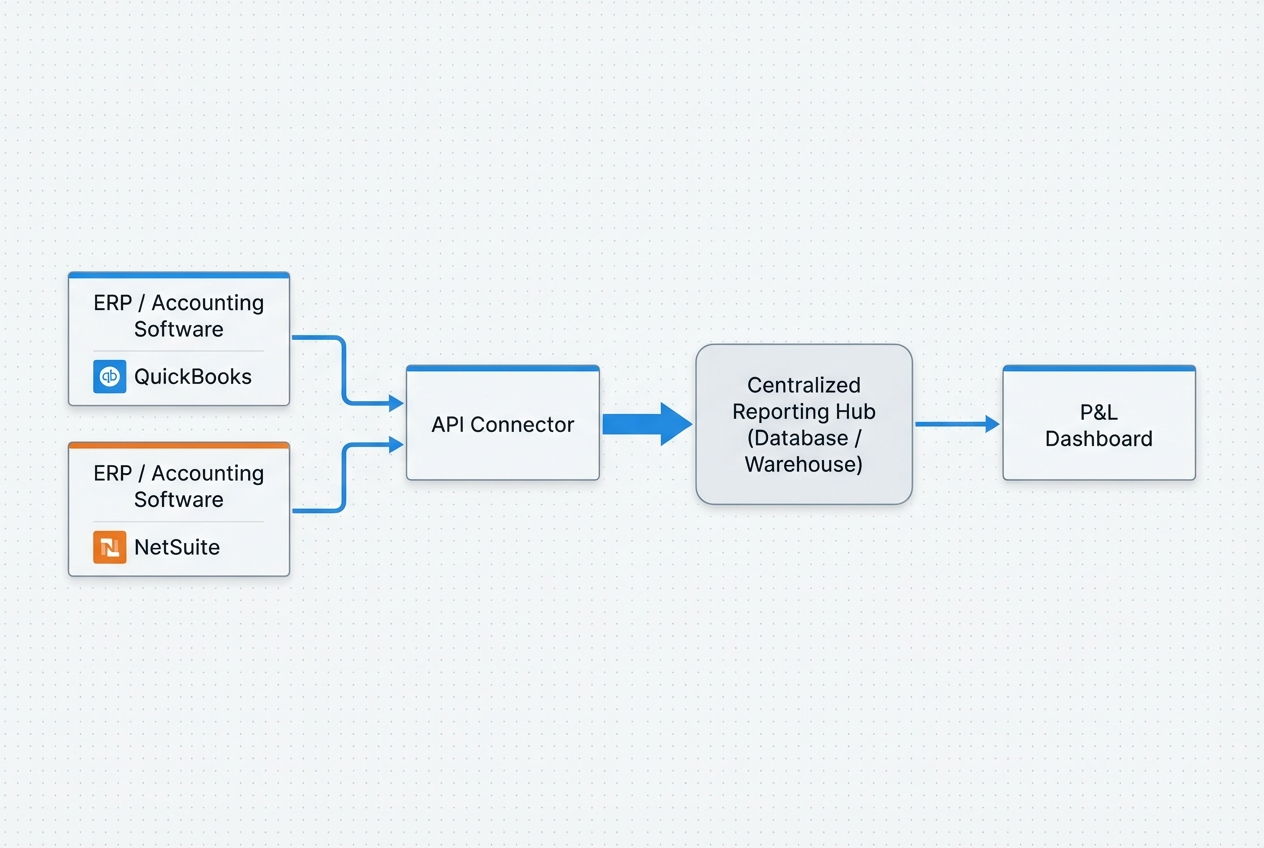
Your goal is simple: make your accounting system the source of truth, then pull data from it automatically.
Most modern systems support API connections, including QuickBooks Online, NetSuite, and Sage. An API (application programming interface) is just a secure way for one system to read and write data in another system, without exports.
What to connect (minimum viable setup):
- General ledger detail: Journal entries, accounts, debits/credits, and posting dates so you can build an accurate income statement.
- Dimensions: Department, class, location, project, customer, and vendor so you can slice results without manual rework.
- Budgets: Your budget table (if you have one) so variance analysis works automatically later.
Recommended approach:
- Connection mode: Start with a read-only connection for reporting.
- Reporting hub: Pull data into a "reporting hub" (a database, warehouse, or reporting dataset).
- P&L build layer: Build the P&L view from that dataset.
Implementation options (pick one):
- Direct to BI tool: Great for small teams, but it can get messy when logic grows and many people edit reports.
- Database first: Better if you want governance, history, auditability, and consistent rules across reports.
If you are connecting QuickBooks Online, Intuit's documentation is the best place to start for endpoints and auth flows. For smaller teams evaluating which systems to automate first, our finance process automation guide for small business covers the basics.
Step 2: Map the Chart of Accounts (COA)
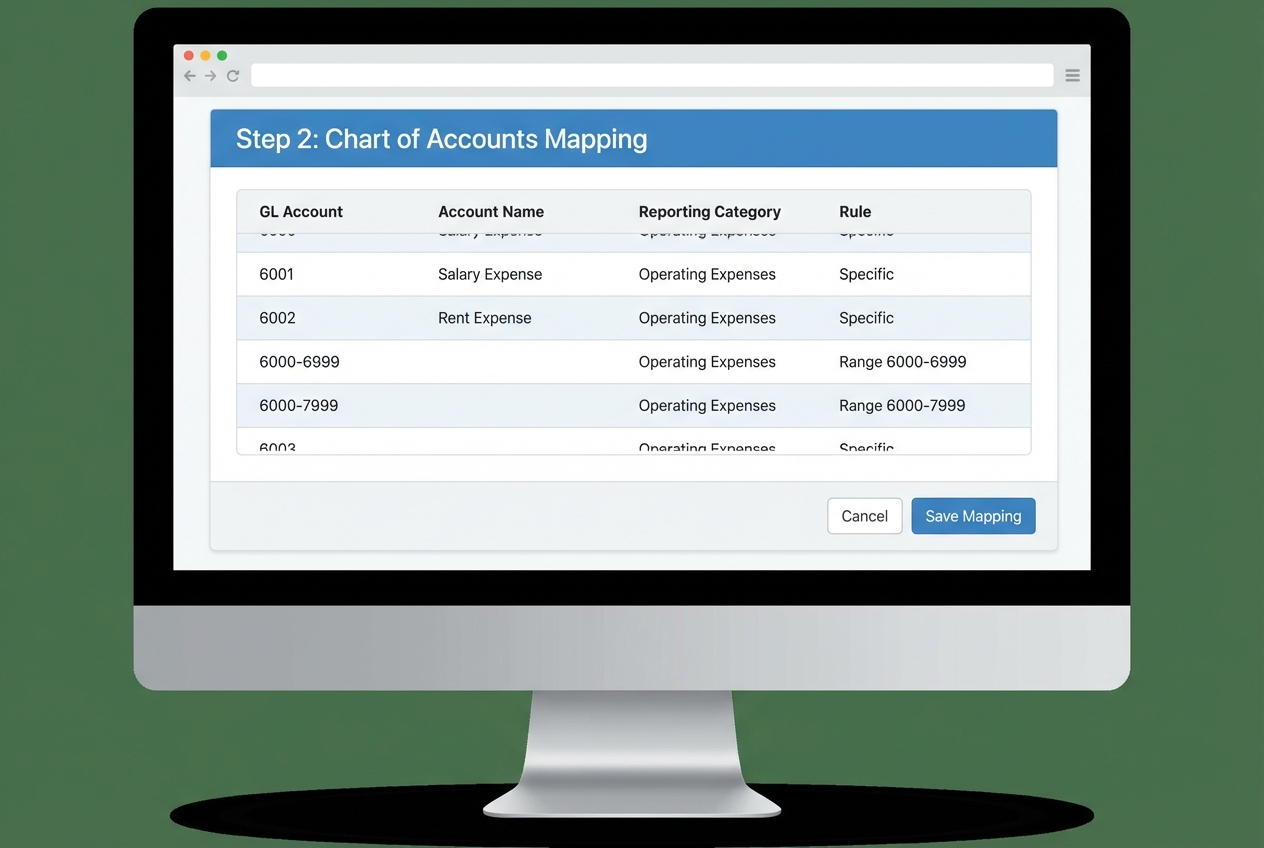
Automated P&L reporting breaks if your chart of accounts is messy. The fix is not "clean it up later." The fix is a mapping layer.
You map granular GL accounts (like 6105 -> Software Subscriptions) into high-level P&L lines (like Operating Expenses -> Software).
What "rule-based mapping" means:
- Rules by range or pattern: Create rules like "all accounts between 6000 and 6999 go to Operating Expenses."
- Auto-categorization for new accounts: When a new account is added in the ERP, it lands in the right category automatically.
Here is a simple example you can copy as a starting point:
| GL Account Range / ID | Account Name Example | Reporting Category | Rule Type |
|---|---|---|---|
| 4000–4999 | Product Revenue | Revenue | Range |
| 5000–5999 | Cost of Goods Sold | COGS | Range |
| 6000–6999 | Rent, SaaS, Contractors | Operating Expenses | Range |
| 7100 | Bank Fees | Operating Expenses | Exact match |
| 8000–8999 | Interest Expense | Other Expense | Range |
Build it like a system:
- Rule ownership: Assign a clear owner who approves and maintains mapping changes so categories do not drift.
- Change log: Record edits like a code change (date, reason, approver) so you can trace why reports changed.
- Coverage validation: Run a daily check for unmapped accounts and flag them before month-end.
Step 3: Configure Department and Project Dimensions
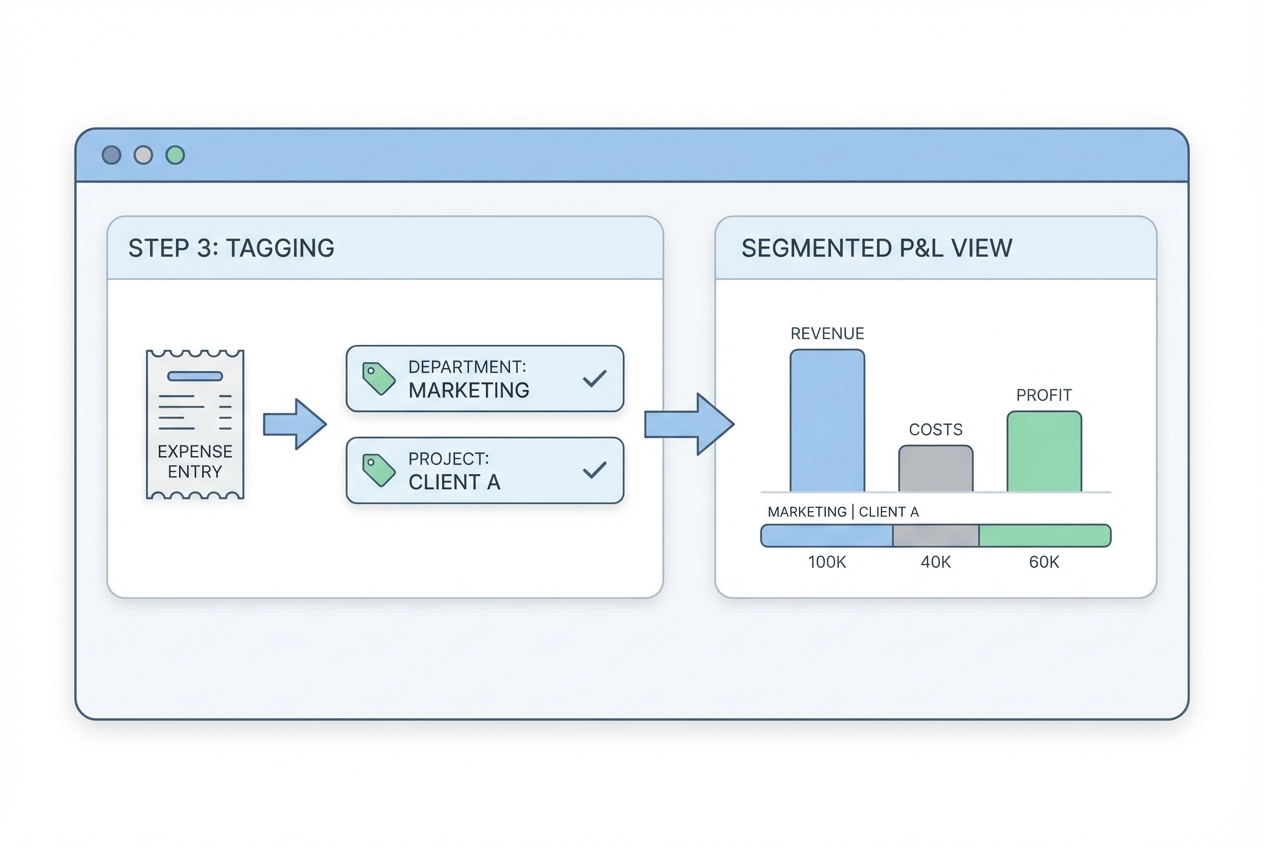
A normal P&L tells you if the business is healthy. A dimensioned P&L tells you why.
Dimensions are extra tags on transactions. They let you slice the same P&L by:
- Department: See performance for Marketing, Delivery, Ops, and more without rebuilding the report.
- Project: Understand profitability for each client or internal initiative (Client A vs Client B).
- Location: Break results down by office, region, or country when that matters to decisions.
- Product line: Compare plans or offers (Plan A vs Plan B) without creating separate reporting systems.
How to implement dimensions:
- Tag at the source: Apply department and project tags when the transaction is created (bill, expense, vendor bill, timesheet) so reporting is automatic later.
- Keep the list small: Start with a tight allowed list (like "Marketing, Sales, Admin") before you expand into dozens of tags.
- Default what you can: Create defaulting rules (for example, Vendor X defaults to Department = Ops) to reduce manual tagging.
Common pitfall to avoid:
- Dimension drift: When people create new tags ad hoc ("Marketing", "Mktg", "Marketin"). Fix it with a controlled list and validation.
This is also where "AI in accounting" becomes real, not hype. AI is useful when it helps categorize, tag, and route items consistently, so you get clean data without extra headcount.
Step 4: Enable Scheduled Refreshes and Real-Time Syncing
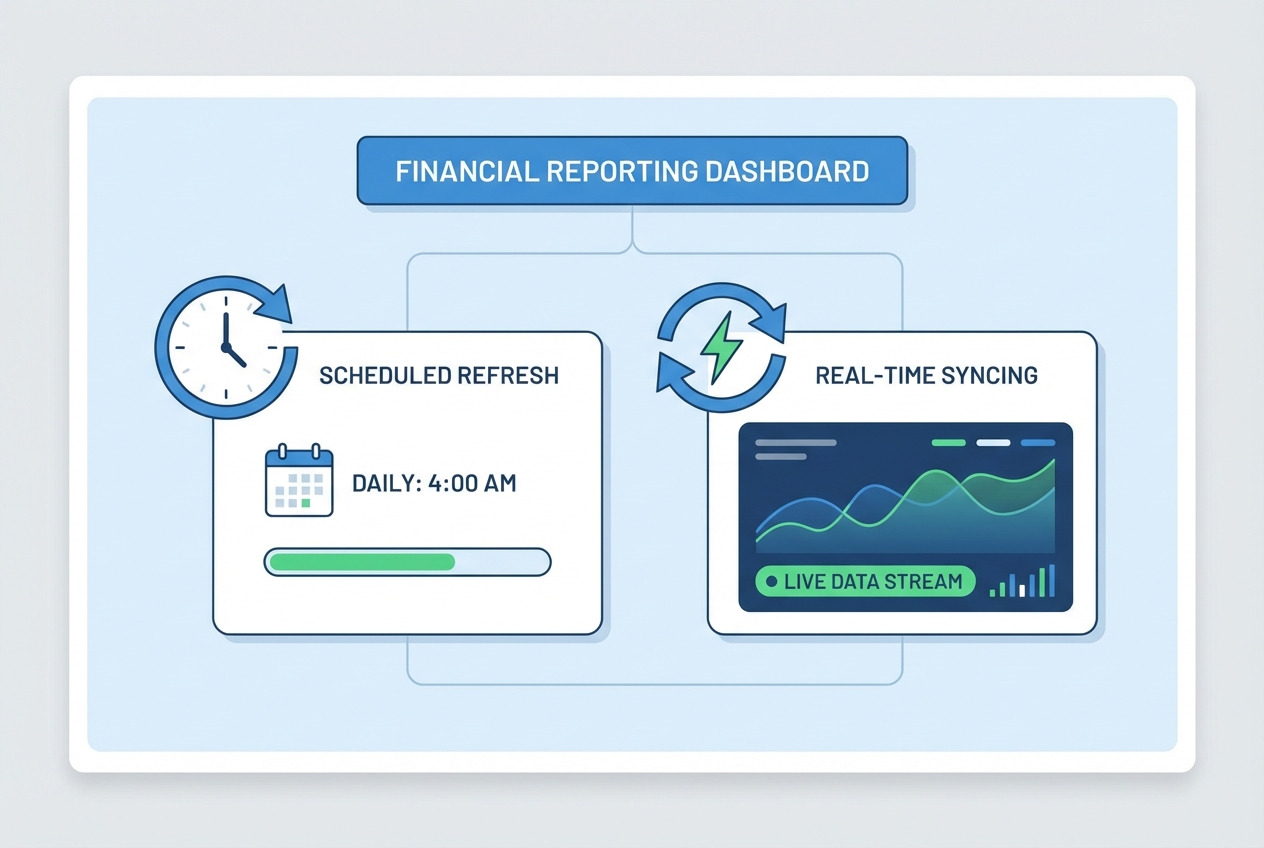
Now you make it "automatic."
There are two common modes:
- Scheduled refresh: Your dataset updates every hour, every morning at 6 AM, or every night, depending on what your team needs.
- Near real-time syncing: New entries appear quickly, sometimes within minutes, depending on the connector and system limits.
If you use Power BI, scheduled refresh is a standard pattern, and Microsoft documents the setup and constraints clearly. For more on real-time reporting benefits, see our article on financial reporting automation.
A good default schedule (for most small teams):
- Leadership visibility: Run a daily refresh at 6 AM so leaders start the day with fresh numbers.
- Month-end acceleration: Switch to hourly refresh during the last 5 business days of close to reduce surprises.
- Finance control: Add a manual "refresh now" button so finance can validate adjusting entries immediately.
Opinion (clearly labeled): If you are under $10M revenue and do not have heavy transaction volume, hourly refresh is usually enough. Real-time sync is great, but it can add cost and complexity. Earn it when you truly need it.
Enhancing Reports with Variance Analysis and Exception Flags
Automated reporting points you to the key items needing attention beyond the raw numbers. This is where your P&L becomes a management tool, not just a statement.
Automated Variance Analysis
Variance analysis compares:
- Actuals vs budget: Shows whether you are on plan and where you are drifting. For a deeper dive, see our guide on budget vs actual automation.
- Actuals vs prior month: Helps you spot sudden step-changes (a tool that doubled in cost, a new contractor, a pricing change).
- Actuals vs prior year: Useful for seasonality and longer-term trends, especially in services and subscriptions.
How to set it up:
- Structured budgets: Store budgets in a table (database, planning tool, or controlled sheet), not as a one-off workbook that changes monthly.
- Shared mapping: Match budget lines to the same COA mapping you use for actuals so category comparisons are always clean.
- Clear thresholds: Define percent and dollar thresholds so noise does not distract you from real issues.
What to include in every variance view:
- Dollar variance: The raw change (example: +$12,400) so you see magnitude instantly.
- Percent variance: The relative change (example: +18%) so small categories do not look "fine" when they are actually spiking.
- Driver note: A short explanation field finance can fill in, right on the line item, so leadership gets context without extra meetings.
Setting Up Exception Flags
Exception flags are automated alerts that fire when something looks wrong or simply needs review.
Examples:
- Budget overage trigger: Flag when Marketing spend exceeds budget by 10% so you can decide fast, not after month-end.
- Margin protection trigger: Flag when gross margin for a project drops below 30% so delivery and finance can respond early.
- New vendor trigger: Flag when a new vendor appears with spend over $5,000 to catch unexpected tools or fraud risk.
- Unmapped account trigger: Flag when an unmapped account shows up so it does not break your reporting categories.
Implementation pattern:
- Trigger rule: Define the condition (threshold, category, timeframe) in plain language first, then translate it into logic.
- Owner: Assign who gets notified (finance, department head, project owner) so alerts do not die in a shared inbox.
- Action: Define what happens next (comment, approve, reclass, investigate) so every alert leads to a decision.
Best Practices for Close Acceleration via Automation
- Standardize data at the source: Create naming conventions and enforce required fields (department, project, vendor category). Clean inputs create clean P&Ls.
- Use templates: Reuse the same P&L layout, mapping logic, and variance thresholds across periods. This prevents "custom report chaos."
- Automate intra-company eliminations: If you have multiple entities, define elimination rules once and run them every refresh. Do not "do it in Excel at the end."
- Foster collaboration: Put comments and questions directly on P&L line items. This cuts down on email threads and repeated meetings.
If you present financials to a board, our guide on board reporting automation covers how to extend these practices to director-ready packs.
Wrapping Up
Automated P&L reporting is the foundation of a faster close and a calmer finance function. You remove manual data manipulation, reduce spreadsheet risk, and give the business a living view of performance. Once your P&L is automated, consider extending the same approach to cash flow reporting automation for complete financial visibility.
Start small:
- connect your GL,
- map your COA,
- add dimensions,
- refresh on schedule, then layer in variance analysis and exception flags.
If you want to turn this into a working system in days, not months, Quantum Byte can help you design and build the workflow end-to-end.
Frequently Asked Questions
How does automated P&L reporting improve accuracy?
It eliminates manual data entry and reduces spreadsheet formula drift by pulling data directly from the ERP via API into a consistent mapping layer. This creates a single source of truth.
Can I automate P&L reporting using Excel?
Yes. You can use Power Query, connectors, or add-ins to pull data directly from your accounting system. The trade-off is governance. Excel solutions often struggle with dimension control, permissioning, and repeatable close workflows.
What are the best tools for P&L automation?
Common options include FP&A platforms (for planning + variance workflows) and BI tools (for flexible visualization). Your best choice depends on whether you need budgeting, approvals, multi-entity consolidation, and audit trails. For a broader look at accounting tools, see our guide on accounting automation software.
If you want a custom workflow that matches your exact close process, Quantum Byte can build a lightweight reporting app that connects to your stack and grows with you.
How long does it take to implement automated reporting?
A basic setup (one entity, clean COA, a few dimensions) can be done in a few days. More complex environments (multi-entity, eliminations, messy tagging) often take several weeks because the mapping and governance matter.
Does automation replace the need for an accountant?
No. It shifts the role from manual data work to analysis, review, and advising the business. That is where your finance function creates leverage.