
According to Gartner, 58% of finance functions are now using AI, up 21 percentage points from 2023. Finance organizations that embrace automation can expect significantly higher efficiency and strategic output than those that do not.
Many teams already know they should automate. The real challenge is proving it pays off.
This guide gives you a practical framework for measuring finance automation ROI without hand-wavy math. You will learn how to:
- Build a clean baseline: Set a before-state that your team can trust, so your ROI holds up in reviews.
- Quantify savings beyond labor: Capture the money leakages most teams miss, like errors, close speed, and risk exposure.
- Calculate ROI and payback period step-by-step: Use simple formulas that make your business case easy to defend.
- Track performance over time: Put a measurement rhythm in place so ROI improves every quarter.
If you are scaling a business and finance ops are starting to feel like quicksand, this is your playbook.
1. The Core Framework for Finance Automation ROI
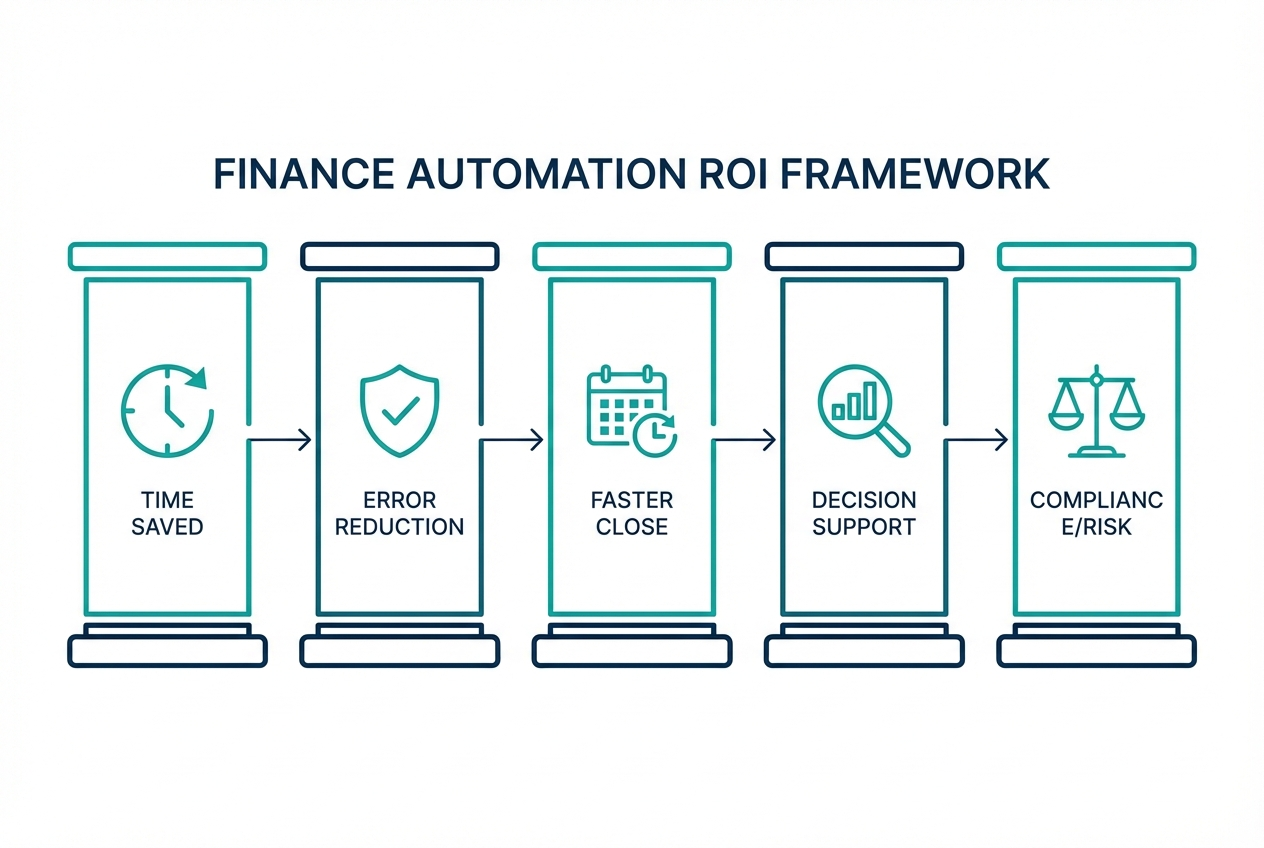
To understand the true impact of your investment, measure value across five pillars. This prevents the most common ROI mistake: only counting labor savings.
Time Saved through Efficiency
Start with your "Fully-Loaded Hourly Rate." That is salary plus benefits plus payroll tax plus overhead. This matters because automation does not just remove tasks. It redirects expensive human time toward higher-value work like analysis, forecasting, and vendor strategy.
A strong ROI case also accounts for labor reallocation, not just labor reduction. Forrester's TEI approach often highlights this concept in ROI modeling for automation initiatives.
What to measure:
- Manual touch time per transaction: How many minutes an invoice, payment, or journal entry takes today.
- Volume per month: Invoices, bills, expense reports, cash applications, payroll adjustments.
- Loaded hourly rate: Use a blended rate if multiple roles touch the process.
Error Reduction and Data Accuracy
Manual workflows create avoidable costs. Errors trigger rework, delay the close, and can even cause vendor issues or incorrect reporting.
Manual data entry has an error rate of up to 4% in many operational contexts. Even "small" error rates can be expensive at scale because each correction includes investigation time, back-and-forth messages, and reconciliation.
What to measure:
- Cost per correction: Minutes spent by AP, approver, and manager plus any fees or write-offs.
- Downstream impact: Payment delays, duplicate payments, customer credit issues, and strained vendor relationships.
Accelerating the Financial Close
A faster close frees up time for decision-making. It also gives leadership fresh numbers sooner.
If you close in 10 days and can bring it down to 4, you gain a "strategic premium." You can act on numbers while they still reflect reality.
To benchmark your close cycle, you can reference APQC's close-cycle measures (for example, monthly close cycle time) to frame what "good" looks like in your industry.
What to measure:
- Close duration (days): Start to final sign-off.
- Bottlenecks: Reconciliations, intercompany, accruals, revenue recognition, AP cutoff.
- Hours of overtime: Especially during month-end.
Strategic Decision Support
This is where automation stops being "back office" and becomes a growth lever.
When your data is clean and current, you get better cash forecasting, budget variance analysis, and faster scenario planning. Strong financial reporting automation makes this possible by delivering real-time dashboards instead of static month-end reports.
What to measure:
- Forecast accuracy: Compare pre-automation and post-automation forecast variance.
- Speed to answer: Time to produce a cash position or margin view when leadership asks.
Compliance and Risk Mitigation
Automation creates a stronger audit trail. Approvals, timestamps, and system logs reduce ambiguity and shrink the "explaining" time during audits.
It also helps prevent duplicate payments and fraud patterns by enforcing controls and flagging anomalies. Tipalti's overview of AP automation ROI discusses these risk-related benefits, including duplicate payments and fraud prevention (Tipalti).
What to measure:
- Audit hours and fees: External audit cost plus internal prep time.
- Control exceptions: Number of policy violations, missing approvals, and late approvals.
- Avoided losses: Duplicate payments discovered, fraudulent attempts blocked.
2. How to Calculate Finance Automation ROI (Step-by-Step)
Below is the step-by-step method you can use for a board-ready ROI model.
Step 1: Identify Total Investment Costs
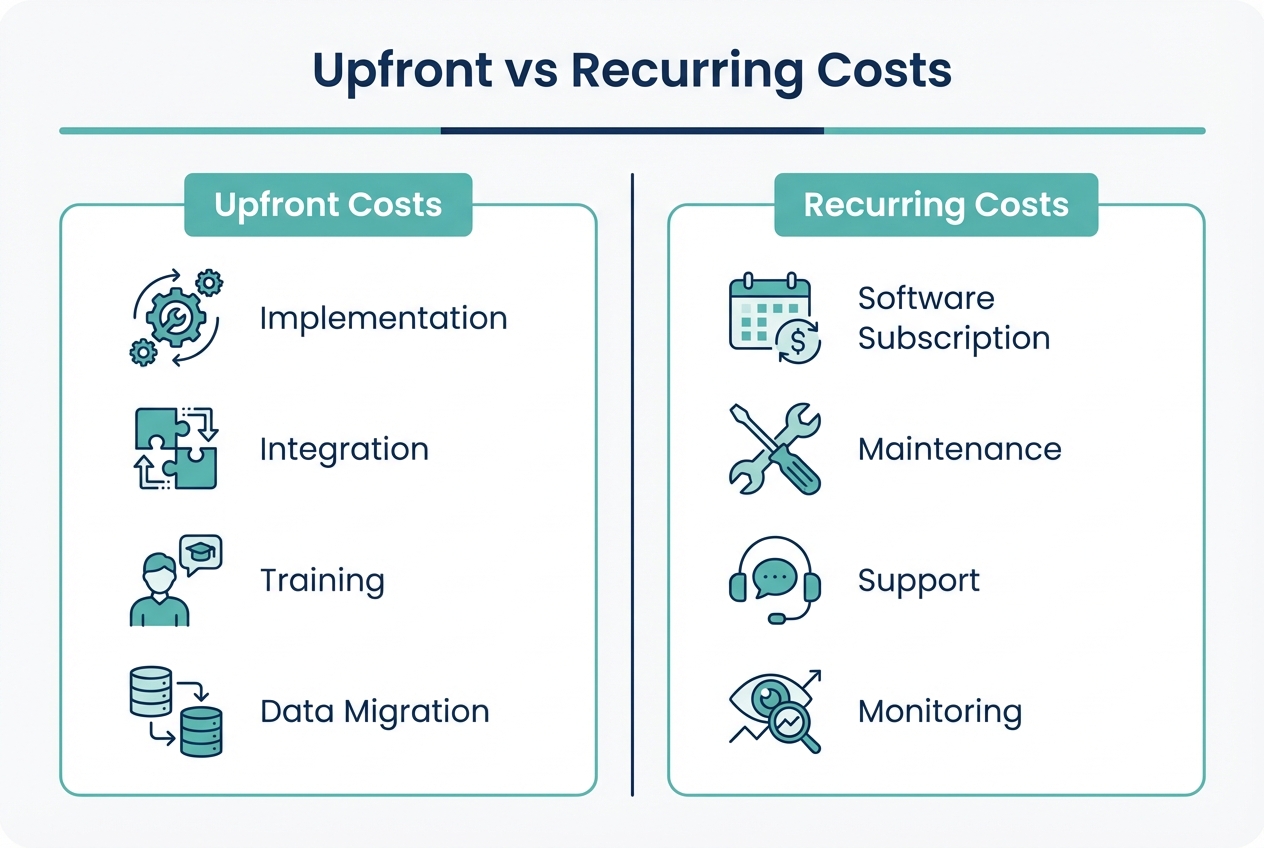
Create two buckets: upfront and recurring.
Upfront (one-time) costs usually include:
- Software setup and implementation: Vendor onboarding, configuration, workflows.
- Integration work: Connecting ERP, billing, payroll, banking, CRM.
- Data migration: Vendor lists, chart of accounts mapping, historical data.
- Training time: Training cost includes the trainer and your team's time away from work.
Recurring (ongoing) costs usually include:
- Subscription or licensing: Per user, per transaction, or tiered.
- Support and maintenance: Vendor support tiers, monitoring tools.
- Ops ownership: Someone internally still "owns" the process and exceptions.
Practical tip: keep a notes column showing what is included. When finance leaders review ROI, hidden assumptions are what get attacked first.
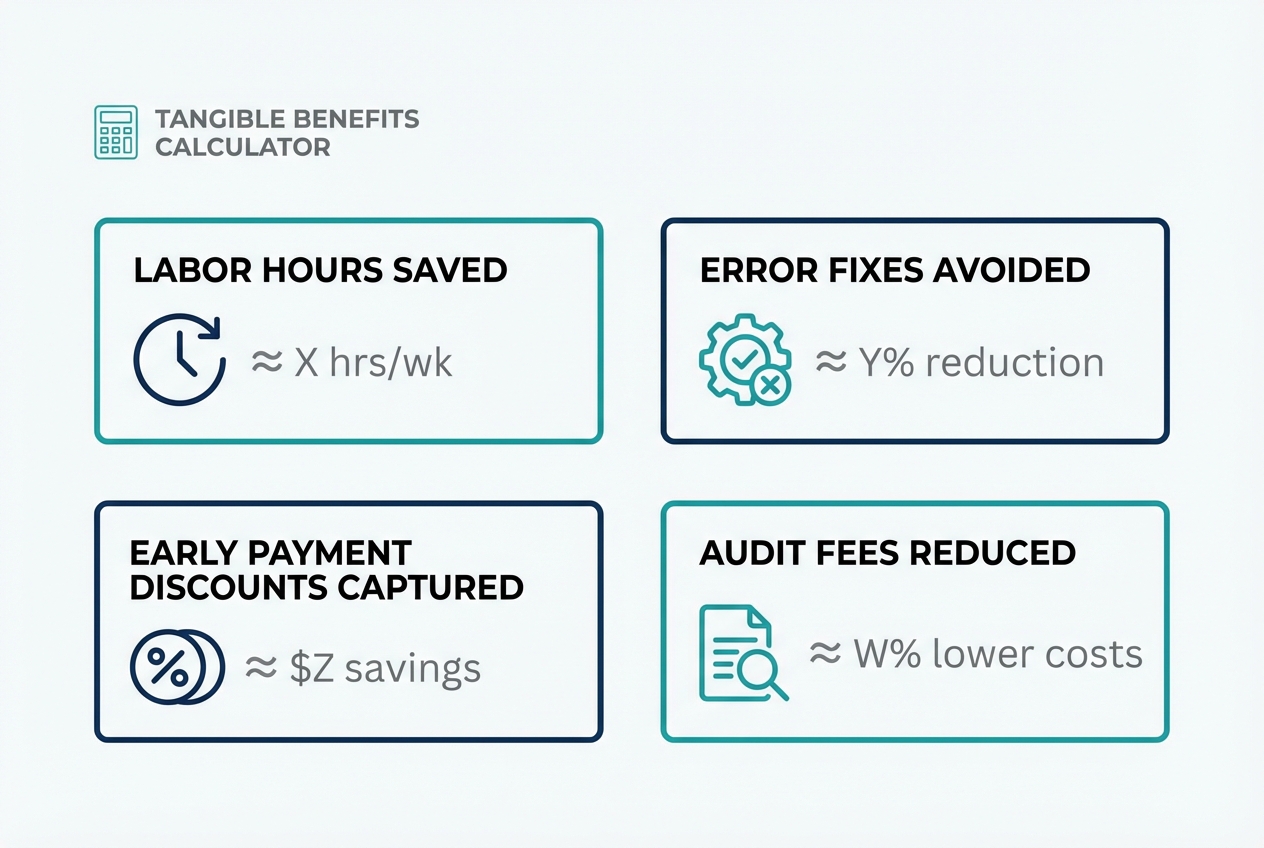
Step 2: Quantify Tangible Benefits
Use this equation:
(Total Annual Benefits - Annual Operating Costs) = Net Annual Savings
Tangible benefit categories to include:
- Labor time saved: Hours reduced or redeployed × fully-loaded hourly rate.
- Error reduction: Fewer corrections, fewer reissues, fewer disputes. Accounting automation can push accuracy to 99.9%.
- Early payment discounts captured: Discounts you missed because approvals were late. Invoice automation helps you hit payment windows consistently.
- Audit and compliance savings: Fewer hours chasing approvals and evidence.
Here is a simple table you can copy into a spreadsheet.
| Benefit Area | How to Calculate | Annual Value (Example) |
|---|---|---|
| Labor time saved | (Hours saved per month × 12) × loaded hourly rate | $72,000 |
| Error correction avoided | (Errors avoided × minutes per error ÷ 60) × loaded hourly rate | $18,000 |
| Discounts captured | Sum of discounts previously missed (12 months) | $12,000 |
| Audit prep reduction | Internal hours saved × loaded hourly rate + fee reduction | $10,000 |
| Total annual benefits | Sum of above | $112,000 |
Do not stress about being perfect. The goal is to be honest and consistent. You can tighten the numbers after the first quarter.
If you want help deciding what to automate first, a good next step is mapping your workflow and identifying handoffs. That is exactly what strong process automation solutions should do before you build anything.
Step 3: Apply the ROI Formula
Use the standard ROI formula:
ROI (%) = (Net Annual Savings / Total Initial Investment) × 100
Example:
- Total initial investment: $100,000
- Net annual savings (year one): $150,000
ROI = (150,000 / 100,000) × 100 = 150%
Note: Some teams define "net savings" after subtracting annual operating costs. Others subtract operating costs earlier. Either approach is fine if you stay consistent and show your math.
Step 4: Calculate the Payback Period
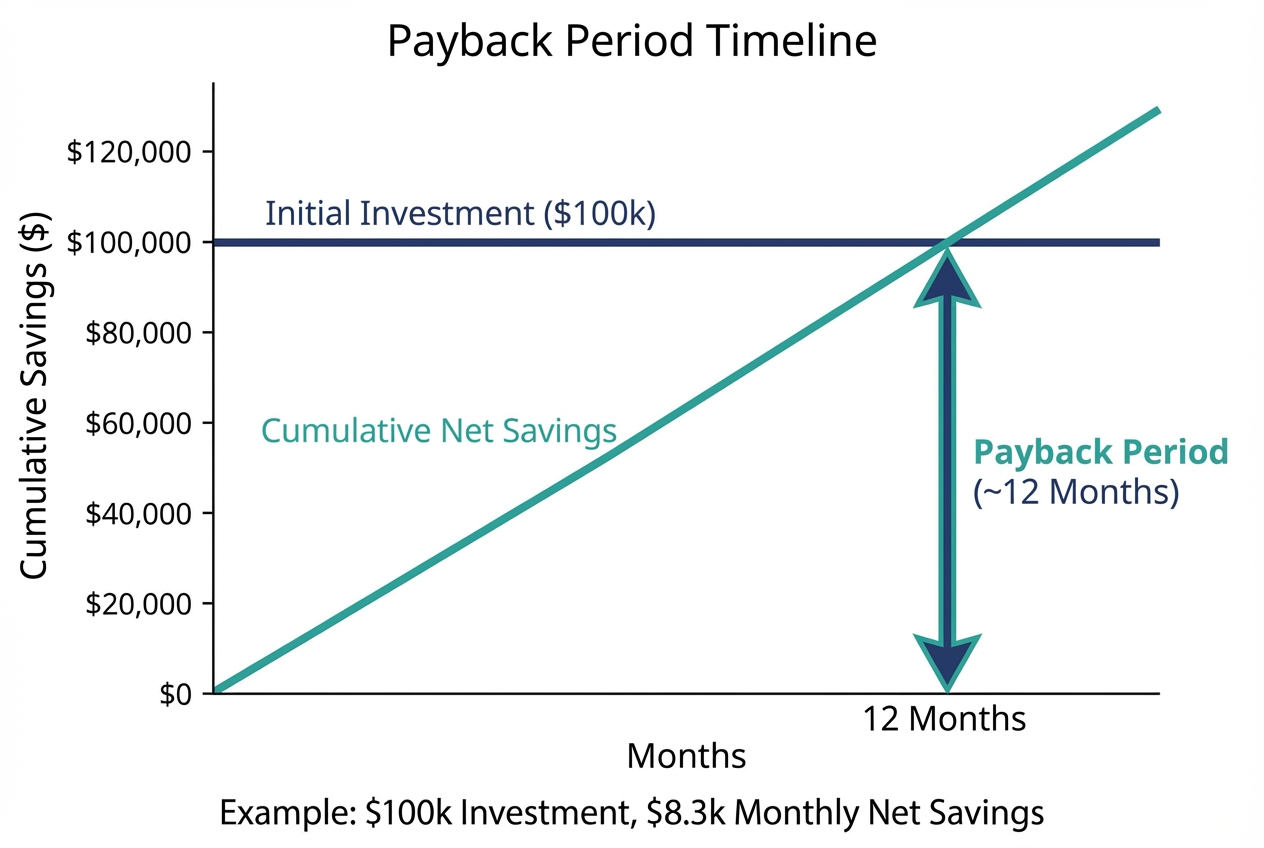
Use:
Payback Period = Total Initial Investment / Net Annual Savings
Example:
- Initial investment: $100,000
- Net annual savings: $100,000
Payback Period = 100,000 / 100,000 = 1 years
In many finance automation projects, a 12 to 18 month payback period is a solid target. Faster is possible when you automate the highest-friction workflows first.
If you need speed, this is where a custom approach can beat a one-size-fits-all tool. For example, Quantum Byte can help you map a strategic automation roadmap, then build lightweight apps and workflow automations "in days, not months" using AI plus engineers when edge cases appear. That combination often reduces time-to-value, which directly improves payback.
3. Measuring Long-Term Performance
ROI starts as a one-time calculation, then becomes a system you improve.
The best teams set a baseline, launch, then optimize every quarter.
Establish Key Performance Indicators (KPIs)
Track KPIs that prove automation is working and staying healthy:
- Straight-Through Processing (STP) Rate: Percentage of invoices or transactions handled without human intervention. This shows how much work is truly "hands-off," not just digitized.
- Cost per Transaction: Total department cost divided by volume of transactions. This is the cleanest metric for showing scale without hiring.
- Employee Satisfaction: Survey the team about the reduction of repetitive work. Burnout is expensive, even if it does not show up as a line item.
If you want to push beyond basic automation, add:
- Exception rate: Percent of items that require manual review, which often points to rules you can tighten. Expense management automation can reduce exception rates significantly by enforcing policy at submission.
- Cycle time per workflow: Invoice received → approved → paid, which reveals where approvals or exceptions are slowing you down.
Iterative Optimization
Here is the pattern that consistently increases ROI over time:
- Quarterly process review: Look for bottlenecks, exception causes, and approval delays so you know what to fix next.
- Tighten rules: Update vendor rules, approval logic, and thresholds to reduce exceptions and rework.
- Add intelligence: Layer in predictive analytics for cash forecasting, anomaly detection, and trend alerts.
We recommend a quarterly review rhythm, because finance processes change as your business grows. New products, new vendors, new payment methods, and new reporting needs all affect ROI.
4. Common Pitfalls in Calculating ROI
Most ROI models fail for simple reasons. Avoid these and your business case gets much stronger.
- Ignoring the "soft" benefits: Strategic agility is hard to price, but it matters. Faster decisions can prevent cash crunches and reduce missed opportunities. If you cannot price it, track it as a narrative metric alongside the hard numbers.
- Underestimating training time: People need time to learn new workflows. Build in ramp time and expect the first month to be messy.
- Data silos: ROI gets diluted when automation does not integrate with your ERP, payroll, or banking. Integration is not a "nice to have." It is where the savings comes from. Workflow automation software can bridge these gaps when systems do not talk natively.
Wrapping Up
The fastest ROI usually comes from automating one end-to-end workflow first, like invoice intake → coding → approval → payment. Partial automation often looks good in demos, then disappoints in real life.
Feel free to book a call with us to understand how we can help you save and make the finance automation ROI make sense!
Frequently Asked Questions
How do you calculate the ROI of automation?
To calculate ROI, subtract the total cost of the automation project from the total savings or gains, then divide that number by the total cost and multiply by 100.
A clean way to model it is:
- Add up annual benefits: labor saved, errors avoided, discounts captured, and audit prep reduced.
- Subtract annual operating costs: subscriptions, support, and ongoing ownership time.
- Divide by the initial investment, then multiply by 100 to get ROI as a percentage.
Quantum Byte's practical recommendation is to include both direct savings and indirect savings like reduced audit prep and risk reduction, as long as you show assumptions clearly. For a deeper dive on the full value equation, see our guide on process automation benefits.
What is a good ROI for finance automation?
A good ROI for finance automation often lands between 30% and 100% in the first year, with many teams aiming for a full payback within 12 to 18 months.
If your payback is longer than 18 months, it usually means one of these is true:
- Low-volume process chosen first: You automated something that does not move enough transactions to create meaningful savings.
- Integration costs underestimated: The real work is connecting systems so data flows without manual handoffs.
- Adoption is low and exceptions are high: People are bypassing the system, or rules are not tuned, so manual work remains.
How can finance automation reduce costs?
Finance automation reduces costs by:
- Removing manual data entry and rekeying: Less time spent typing the same information across multiple tools.
- Reducing correction work caused by errors: Fewer reversals, fewer vendor disputes, fewer reconciliation loops.
- Capturing early payment discounts: Faster approvals mean you actually hit discount windows.
- Lowering audit and compliance overhead: Better traceability means less time hunting for evidence.
What are the intangible benefits of finance automation?
Intangible benefits include:
- Improved employee morale: Repetitive work drops, and people spend more time on analysis and partner-facing tasks.
- Better decision-making: Data is current and consistent, so leadership can act faster with fewer surprises.
- Increased agility: Your business can respond quicker to shifts in pricing, demand, and cash flow.
These can be tracked with surveys, close speed, and "time to answer" metrics even if they are not priced in dollars.
Why do some automation projects fail to show ROI?
Projects often fail to show ROI due to:
- Poor integration with existing systems: ERP, banking, payroll, billing, and CRM data stays disconnected.
- Lack of training and change management: The tool works, but the workflow does not stick.
- Overly complex tooling for the actual need: More features can mean more friction, which kills adoption.
- Automating around the bottleneck: You optimize a small step while the real slowdown remains untouched.