App monetization metrics tell you if your app is becoming a real business or just staying a "nice idea." They connect what users do (downloads, activation, retention) to what you earn (subscriptions, usage revenue, ads, in-app purchases). If you track the right few metrics, you can spot what to fix, what to scale, and when to stop guessing.
App monetization metrics: what to track
Monetization is a system rather than a single number.
Most apps fail to grow revenue for one of three reasons:
-
They do not get enough qualified users: Growth looks fine on downloads, but the wrong people install.
-
They do not convert users into value: People try the app, but never hit the "aha" moment.
-
They do not keep users long enough: Even strong conversion cannot outpace churn (users leaving).
App monetization metrics exist to pinpoint which of those is happening in your product.
The monetization metrics map
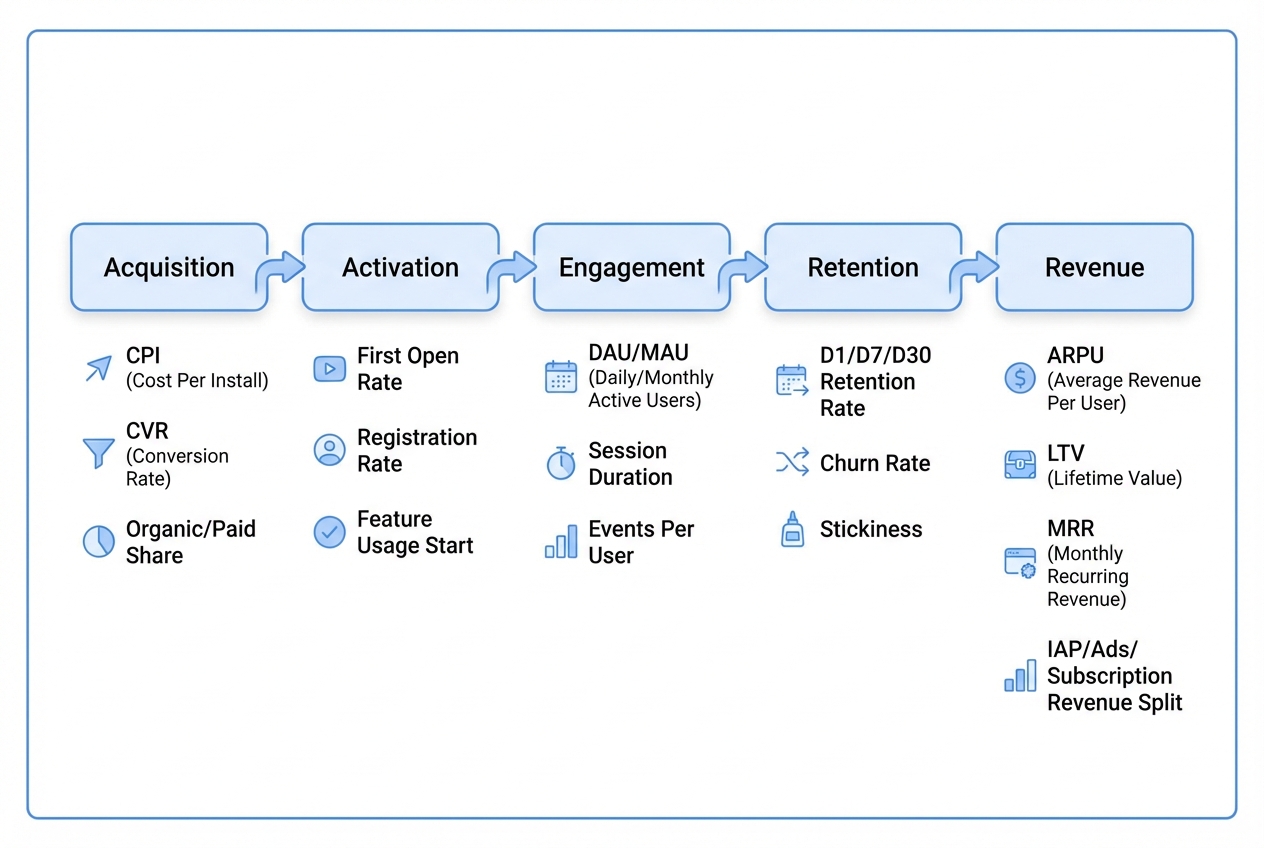 Figure: A practical map of the metrics that drive app revenue.
Use this mental model to keep your tracking simple:
-
Acquisition: How users find you.
-
Activation: Whether new users reach the first meaningful outcome.
-
Engagement: How often they get value.
-
Retention: Whether they come back.
-
Revenue: Whether value turns into money.
If you only measure revenue, you are always late. The earlier metrics are your leading indicators.
Core app monetization metrics
You do not need 50 dashboards. You need a small set of metrics you can trust.
The "must-have" metrics table
| Metric | What it tells you | How to calculate it (plain English) | Best for |
|---|---|---|---|
| Activation rate | Whether users reach the first "aha" moment | Activated users ÷ new users | Any app, especially B2B (business-to-business) tools |
| Retention rate | Whether users come back and keep getting value | Returning active users ÷ users who installed/started in the cohort | Subscription, freemium, and usage-based apps |
| Churn rate | How fast you lose customers or subscribers | Lost customers ÷ starting customers (for the period) | Subscription apps (and any app with accounts) |
| ARPU (Average Revenue Per User) | Monetization efficiency per user/account | Total revenue ÷ active users (or paying users) | Comparing plans, segments, and channels |
| LTV (Lifetime Value) | How much revenue a customer generates over their lifetime | Typically ARPU × expected lifetime (often derived from churn) | Pricing, paid acquisition, hiring decisions |
| Conversion rate (free to paid) | Whether value turns into payment | New payers ÷ eligible users (trial users or free users) | Freemium and trial-to-paid apps |
| MRR (Monthly Recurring Revenue) | Subscription revenue momentum | Sum of monthly subscription revenue | Subscription apps |
| Revenue churn | Whether you are losing revenue even if users stay | Lost recurring revenue ÷ starting recurring revenue | B2B plans, upgrades/downgrades |
App Store and Play Store monetization metrics
If you rely on organic store traffic, your store listing is part of your revenue engine.
App Store conversion rate
Apple defines App Store conversion rate in App Analytics as the ratio of Total Downloads to Unique Impressions: Measuring App Performance.
Practical takeaway:
-
If impressions are high but conversion is low: Your icon, screenshots, title, or positioning is weak.
-
If conversion is high but impressions are low: Your distribution is weak. You likely need better keywords, referral loops, partnerships, or paid acquisition.
Retention in App Analytics
Apple defines retention as usage over time starting from first installation or re-download.
Practical takeaway:
-
If day-1 retention is low: Your onboarding or first-time experience is not delivering value.
-
If day-7 or day-30 retention drops: Your ongoing value is not strong enough. Improve the core loop, not the marketing.
Google Play Console: keep KPIs visible
Google Play Console supports customizing and pinning a personalized KPI (key performance indicator) section, and frames metrics across areas like engagement, monetization, and churn: Customize KPIs on your Google Play app dashboard.
Practical takeaway:
- If your team is small: Pin the 8 to 12 KPIs that map to your monetization model. Hide the rest.
Monetization model matters: pick metrics that match how you make money
Different revenue models create different "truth" in the data. Do not force subscription metrics onto an ad-driven app.
Quick mapping table
| Monetization model | What success looks like | Metrics that usually matter most |
|---|---|---|
| Subscription (monthly/annual) | Users stick, pay, and expand over time | MRR, retention, churn, LTV, upgrade rate, revenue churn |
| Freemium (free core, paid upgrades) | Free users get value, then a slice upgrades | Activation rate, free-to-paid conversion, ARPU by segment, paywall views, retention |
| Usage-based (pay per action) | Users adopt workflows and usage grows | Activation, repeat usage frequency, ARPU, expansion revenue, cohort retention |
| In-app purchases (IAP) | A small segment purchases repeatedly | Payer conversion, average order value, repeat purchase rate, ARPPU (Average Revenue Per Paying User) |
| Ads | High engagement without killing experience | Session length, ad impressions per user, ad revenue per active user, retention |
A simple rule:
-
If you charge repeatedly: Retention and churn run the business.
-
If you charge occasionally: Conversion and repeat purchase rate matter more.
The metric stack most founders use
If you want a practical starter kit, use this stack.
Level 1: "Is the product working?"
-
Activation rate: Are new users reaching value fast?
-
D1/D7/D30 retention: Are they coming back?
-
Engagement frequency: How often do active users get value?
Level 2: "Is the business working?"
-
ARPU: How efficiently do you monetize?
-
LTV: Is a user worth acquiring?
-
Churn: Are you leaking growth?
Level 3: "Can we scale this without burning out?"
-
CAC (Customer Acquisition Cost): What you spend to get a new customer.
-
LTV:CAC relationship: Investopedia describes customer lifetime value (CLV) and customer acquisition cost (CAC), and notes that comparing the two helps measure acquisition effectiveness: Investopedia KPI glossary.
If you are early-stage, do not obsess over perfect CAC. Start by getting retention and activation right, then make acquisition repeatable.
How to instrument app monetization metrics
Good metrics require good events. That is the unglamorous part. It is also where most teams quietly fail.
Step 1: define your "aha" moment
Write one sentence:
- Your "aha" moment: The first time a user receives the core value they came for.
Examples:
-
Scheduling apps: A user booking their first appointment.
-
Proposal tools: A user sending their first proposal.
-
Coaching apps: A user generating and saving their first plan.
Step 2: design your event taxonomy
Keep it small and consistent.
-
Core events: Actions that prove value (created, sent, scheduled, completed).
-
Monetization events: Viewed paywall, started trial, subscribed, renewed, canceled.
-
Quality events: Errors, payment failures, support tickets created.
Step 3: decide what "active" means
"Active user" is not universal. Choose one definition and stick to it.
- Active user definition: A user who completes at least one core event in the time window (daily, weekly, monthly).
Step 4: segment from day one
Your averages will lie if you do not segment.
At minimum, segment by:
-
Channel: Organic, paid, referral, partner.
-
Persona: Owner, operator, admin, end-user.
-
Plan: Free, trial, paid tier.
Step 5: build one dashboard that drives decisions
A useful monetization dashboard answers these questions quickly:
-
Where are we losing people?: Use activation and retention to pinpoint the exact step where users drop.
-
Where are we losing money?: Watch payment failures, cancellations, and downgrades so revenue does not quietly leak.
-
What should we build next?: Prioritize features that move retention or conversion, not features that only add complexity.
| You are building a custom app, treat measurement as part of the build. Bake tracking into the first release so you can learn quickly.
For a deeper view on how AI-first builds can speed up this instrumentation work, see how an AI app builder works.
The most common mistakes with app monetization metrics
These mistakes are why founders feel like they are "tracking metrics" but still cannot make confident decisions.
-
Tracking vanity metrics: Downloads, page views, and raw signups can look great while revenue stays flat. Tie every metric to a decision you will make.
-
Not separating user churn from revenue churn: Users can stay and pay less (downgrades), or fewer users can pay more (upgrades). Track both when you have tiers.
-
Changing definitions midstream: If "active" changes every month, your trendline is fiction. Write definitions down and version them.
-
No cohort analysis: Averages hide whether new users are improving. Cohorts (grouping users by signup week/month) show if changes actually worked.
-
Measuring too late: If you only notice churn after revenue drops, you are reacting. Use activation and retention as early warning signals.
Turning metrics into product decisions (a simple weekly cadence)
Metrics are only valuable when they shape your roadmap.
A lightweight cadence that works for most small teams:
- Weekly (30 minutes): Review activation, retention, and top funnel conversion.
- Biweekly: Review monetization metrics (ARPU, conversion to paid, churn).
- Monthly: Review cohorts, pricing, and which segments are most profitable.
Use a consistent agenda:
-
What moved?: Call out the 1 to 3 metrics that shifted meaningfully, not everything that changed by 0.1%.
-
Why did it move?: Tie the change to a release, channel shift, pricing test, seasonality, or support volume.
-
What will we change this week because of it?: Write down a single action with an owner and a measurable expected result.
If you want an actionable framework for pricing power and value, pair your metrics work with this breakdown of app monetization strategies with real examples.
Building a metric-ready app faster
If your app idea is still evolving, the fastest path to reliable app monetization metrics is often a prototype that is instrumented from day one.
This is a strong fit for QuantumByte’s approach:
-
Start with product clarity: Turn your idea into clear product documentation so you know what to measure and why.
-
Ship an early version fast: Get a real app into users’ hands quickly, so your metrics reflect real behavior.
-
Instrument the events that matter: Wire in the specific events your monetization model needs before you scale spend.
If you want to go from idea to a build plan you can actually measure, start here: QuantumByte pricing guide.
If you are weighing custom vs off-the-shelf tools (especially for internal apps that later become products), this guide helps: custom business software development: build vs buy.
Final takeaways for app monetization metrics
App monetization metrics are not a reporting exercise. They are your steering wheel.
You now have:
-
Metrics roadmap: A clear map from acquisition to revenue.
-
Starter set: A practical starter set of metrics (activation, retention, churn, ARPU, LTV, conversion, MRR).
-
Grounded definitions: Grounded definitions from Apple, Google Play, Stripe, and Investopedia.
-
Execution plan: A simple instrumentation approach that keeps analytics useful instead of overwhelming.
When you track the right few metrics, you stop guessing. You can focus your limited time on the changes that actually multiply revenue.
Frequently Asked Questions
What are the most important app monetization metrics?
The most important app monetization metrics usually include activation rate, retention rate, churn rate, conversion rate (free-to-paid or trial-to-paid), ARPU (Average Revenue Per User), and LTV (Lifetime Value). Subscription apps often add MRR (Monthly Recurring Revenue) and revenue churn.
What is a good retention rate for an app?
A "good" retention rate depends on your category, audience, and pricing model. The practical benchmark is your own trendline: retention should improve for newer cohorts as you refine onboarding, core value, and pricing. Use day-1, day-7, and day-30 retention to see where users drop.
How do you calculate LTV for a subscription app?
A common simplified method is to estimate LTV using ARPU and churn. Stripe explains LTV as average lifetime revenue and connects a simplified LTV approach to churn assumptions in its SaaS metrics guide: Stripe’s Business of SaaS.
What is the difference between user churn and revenue churn?
User churn measures how many customers leave. Revenue churn measures how much recurring revenue you lose, including cancellations and downgrades. You can have low user churn but high revenue churn if many users downgrade to cheaper plans.
What app store metrics matter most for monetization?
If you depend on store discovery, focus on store conversion and retention. Apple defines App Store conversion rate as Total Downloads divided by Unique Impressions in App Analytics: Measuring App Performance. Retention helps you understand whether acquired users stick.
How many metrics should I track early on?
Start with 8 to 12 metrics that map directly to your monetization model and your current stage. Too many metrics creates noise. Too few hides the real problem.
Do I need a data warehouse to track app monetization metrics?
Not at the start. You need clean event tracking, stable definitions, and a dashboard that drives weekly decisions. A data warehouse can help later when you need more advanced segmentation, multi-product reporting, or deeper cohort analysis.
When should I build a custom app instead of using no-code tools?
When your workflow, data model, or monetization logic becomes your competitive edge, custom often wins. If you are exploring that decision, this framework is a good starting point: custom business software development: build vs buy.