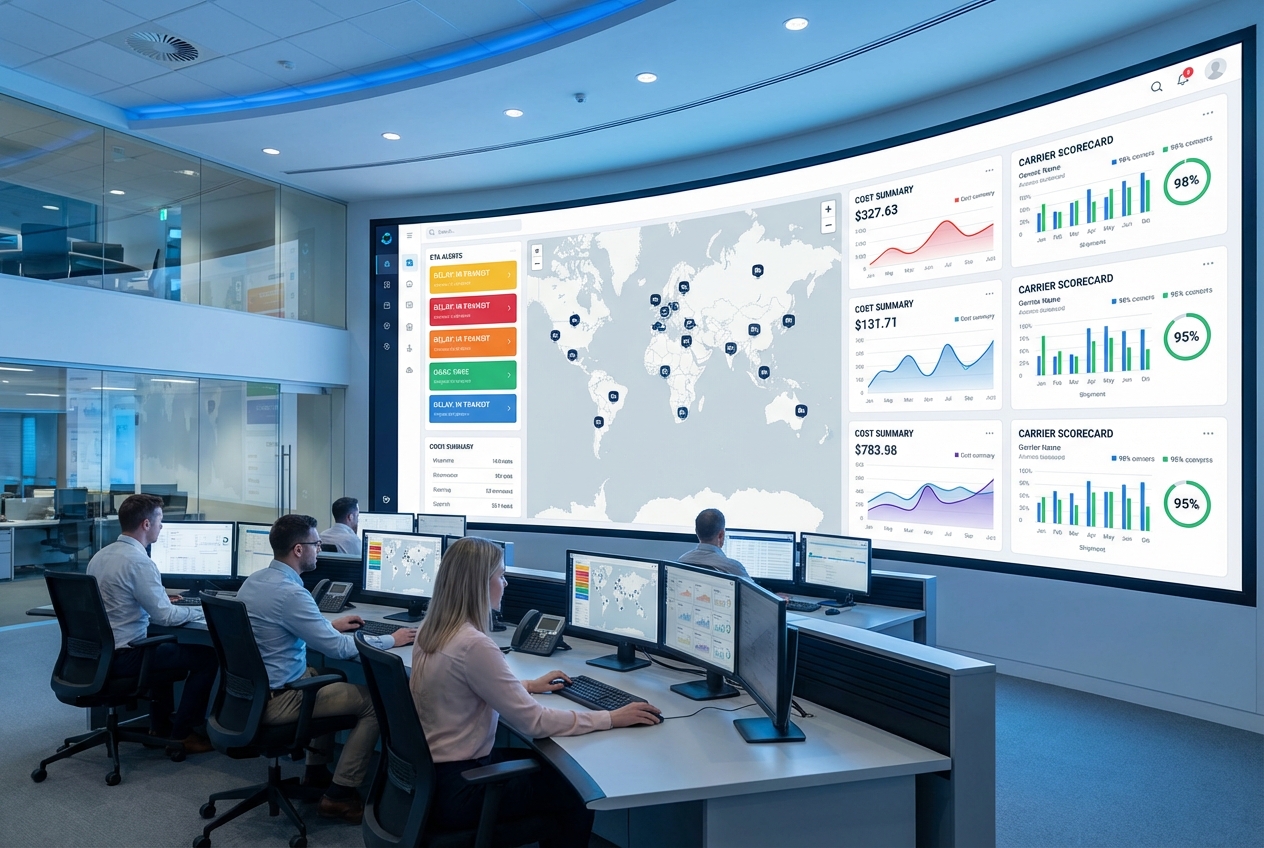
A transport management system dashboard should do one job exceptionally well: tell you what is happening in your freight operation right now, what is about to break next, and what to do about it. If your “dashboard” is a stack of reports, you do not have visibility. You have homework.
This guide ranks the best TMS (Transportation Management System) dashboard options for 2026, shows what your dashboard must include, and explains when a custom build beats any off-the-shelf platform.
What a transport management system dashboard should show (so you can act fast)
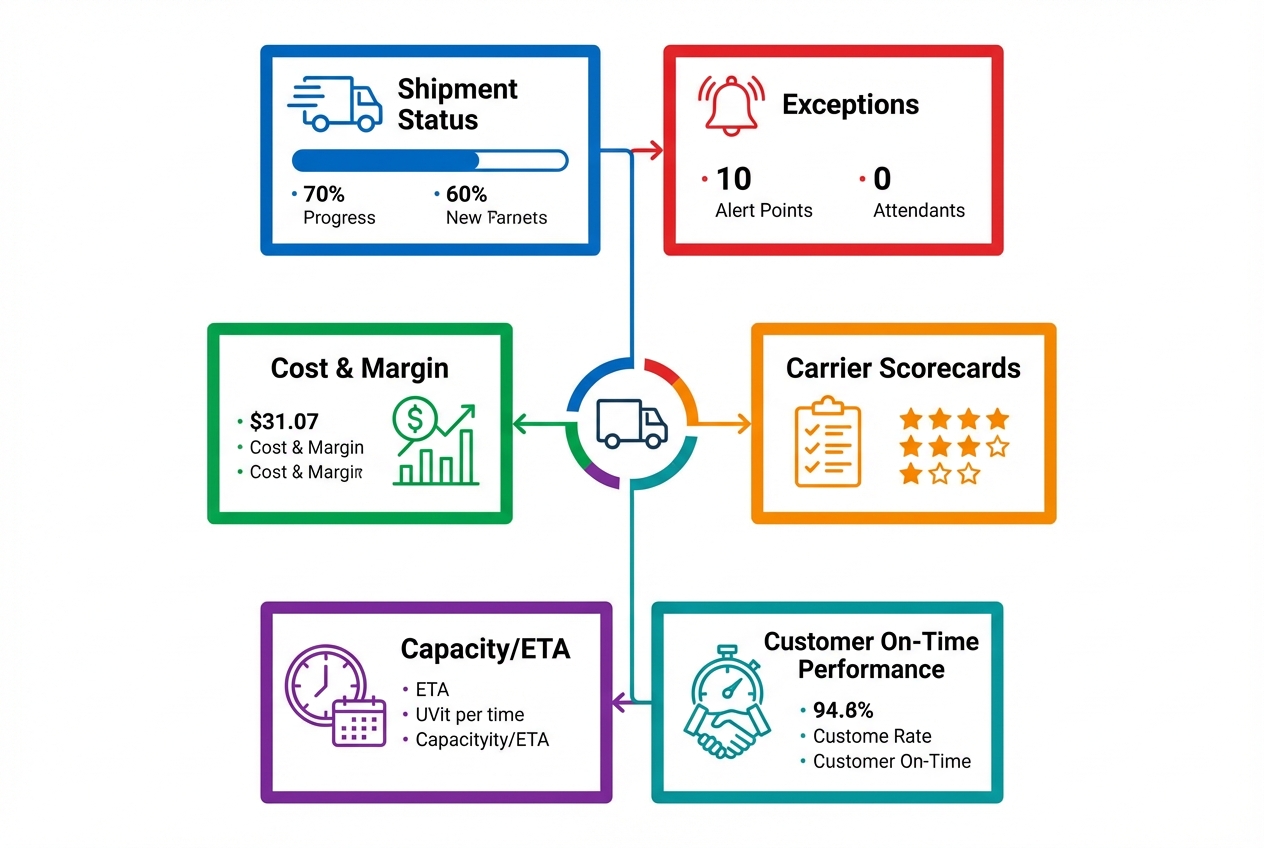 Diagram: The core blocks most teams need in a TMS dashboard, regardless of mode.
A strong dashboard wins with fewer, higher-signal metrics, clear thresholds, and a short path from insight to action. More charts often slow teams down.
Here is what a practical transport management system dashboard typically includes.
- Shipment status and ETA accuracy: A live view of in-transit, at-risk, delayed, delivered, and not-yet-picked-up loads. This is your “control tower” layer.
- Exceptions and alerts: A prioritized queue of problems, not a firehose. Late pickup risk, dwell time breaches, failed tenders, missing documents, and temperature excursions (if you move cold chain).
- Cost-to-serve and margin signals: Freight spend is not enough. You want cost per order, cost per lane, accessorial drift, and where margins get silently eaten.
- Carrier performance scorecards: On-time pickup and delivery, tender acceptance, claims, and appointment compliance. A dashboard should help you decide who gets the next load.
- Capacity and planning health: What is covered vs uncovered, upcoming constraints by lane, and where you need to rebid or shift modes.
- Customer experience KPIs: On-time delivery by customer, perfect order indicators, and “repeat offenders” (lanes or facilities that always create exceptions).
A TMS itself is broader than the dashboard. Gartner’s definition is a helpful baseline: a TMS is used to plan freight moves, rate and shop, select routes and carriers, and manage freight bills and payments, per the Gartner TMS glossary entry.
If you run a fleet or need Hours of Service (HOS) workflows, your dashboard also benefits from ELD (Electronic Logging Device) and RODS (Records of Duty Status) context. The Federal Motor Carrier Safety Administration (FMCSA) explains the ELD rule and its intent, which matters when your dispatch and compliance reporting have to match reality.
Quick comparison of the best TMS dashboard options (2026)
Use this table to narrow your shortlist. The rankings below go deeper.
| Rank | Platform | Best for | Dashboard strengths | Watch-outs |
|---|---|---|---|---|
| 1 | QuantumByte (custom build) | Teams that want “their way” of operating | Custom KPIs, workflows, and role-based views built around your process | You must define the outcomes clearly (we show how) |
| 2 | Oracle Transportation Management | Enterprise shippers with complex networks | Mature operational dashboards, strong optimization ecosystem | Can be heavy to implement and govern |
| 3 | SAP Transportation Management | SAP-centric operations | Planning visibility, cockpit-style execution views | Best value when aligned to broader SAP stack |
| 4 | Manhattan Active Transportation Management | Omni-channel and distribution-heavy networks | Unified visibility and real-time operational view | Often paired with broader Manhattan ecosystem |
| 5 | Blue Yonder Transportation Execution | High-volume execution teams | Dispatcher-friendly dashboard, AI-driven alerts | Requires clean event data to shine |
| 6 | Descartes TMS | Multi-party logistics and visibility-driven teams | Exception management and reporting focus | Module choices matter, scope carefully |
| 7 | Shipwell | Modern teams that want a command center UX | Unified command center and reporting emphasis | Verify integrations you need before committing |
| 8 | FreightPOP | SMB shipping teams needing fast analytics | Power BI-driven metrics and tracking intelligence | Confirm enterprise governance needs |
| 9 | Trimble TMW.Suite | Transportation businesses and fleet-heavy ops | Strong analytics orientation via Trimble Reveal | Fit depends on your operating model |
| 10 | e2open Transportation Management | Global, multi-mode shippers | Broad lifecycle coverage including analytics | Platform breadth can increase complexity |
Best transport management system dashboard platforms (ranked)
1) QuantumByte (best for fully custom transport management system dashboard that fits your operation)
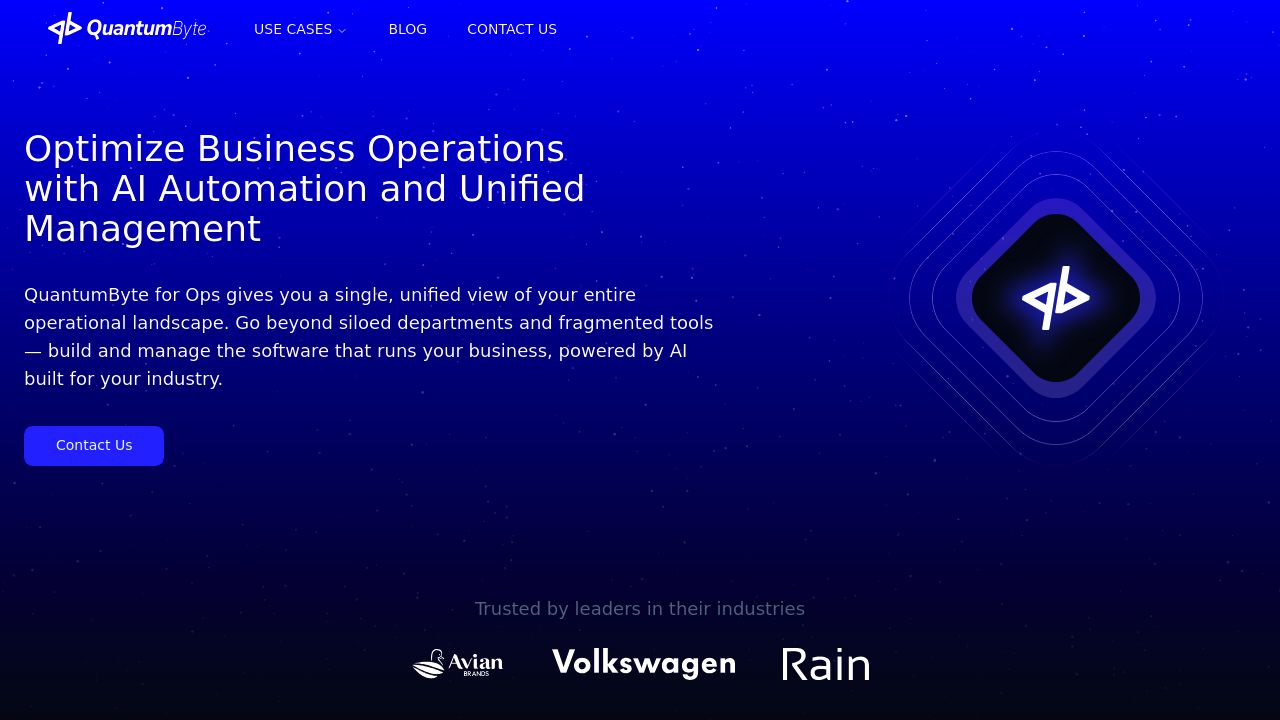
Off-the-shelf TMS dashboards are built for the average company. You are not average. You have unique service promises, lane economics, carrier relationships, and exception workflows.
That is why a custom dashboard is often the best “platform” choice if you are scaling and need the tool to match your operating system.
With QuantumByte Enterprise, you can build a transport management system dashboard around your exact KPIs and workflows. The AI builder helps you go from plain-English requirements to a working app quickly, and the in-house dev team can take you across the finish line when you hit edge cases.
- Best for: Fast-moving operators who want a dashboard that mirrors their playbook, not a vendor’s.
- Dashboard strengths: Role-based views (owner, dispatcher, ops manager, finance), custom exception queues, and metrics that match how you price and deliver.
- Watch-outs: Custom works best when you start with a tight scope. If you are still debating what “on-time” means internally, align definitions first.
If you want a low-friction way to turn your dashboard idea into build-ready requirements, you can get started today.
2) Oracle Transportation Management (OTM)
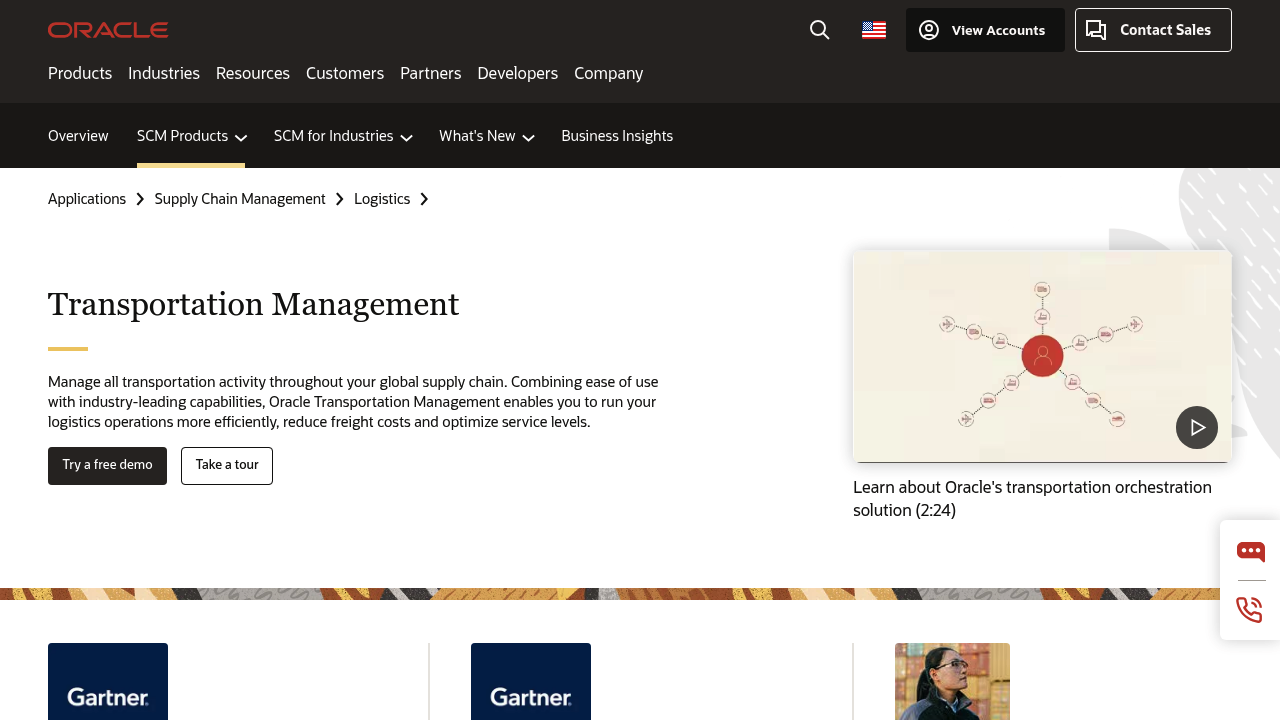
Oracle Transportation Management is a heavyweight option for complex shipping networks that need optimization and enterprise governance.
- Best for: Large shippers and 3PLs (third-party logistics providers) that need strong controls and deep transportation planning.
- Dashboard strengths: Operational metrics and performance views designed for enterprise scale.
- Watch-outs: Expect implementation effort. You will want disciplined master data and process ownership.
3) SAP Transportation Management
If your world already runs on SAP, SAP Transportation Management can be a clean path to cockpit-style planning and execution views.
- Best for: SAP-centric orgs that want freight planning, execution, and visibility aligned to core ERP (Enterprise Resource Planning).
- Dashboard strengths: Interactive planning and execution views, with strong alignment to end-to-end process models.
- Watch-outs: The best experience tends to come when SAP is the system of record for adjacent processes too.
4) Manhattan Active Transportation Management
Manhattan Active Transportation Management leans into unified visibility and the operational heartbeat of fulfillment-heavy networks.
- Best for: Distribution-led businesses that need tight coordination between warehouse activity and transportation execution.
- Dashboard strengths: End-to-end shipment visibility with a strong emphasis on real-time operational decision-making.
- Watch-outs: Often best as part of a broader Manhattan footprint. Confirm integration approach early.
5) Blue Yonder Transportation Execution
Blue Yonder Transportation Execution stands out for execution teams who live in the “today” view: workload, dispatch, and exceptions.
- Best for: High-volume execution environments where dispatchers need clarity and speed.
- Dashboard strengths: Dispatcher-friendly workload views and event-based alerting.
- Watch-outs: Alert quality depends on data quality. Invest in clean milestone events and location accuracy.
6) Descartes TMS
Descartes TMS is a strong candidate when visibility, exception management, and reporting depth are central to your operation.
- Best for: Shippers and logistics providers that need a robust operational view with actionable exception handling.
- Dashboard strengths: Reporting and analytics emphasis, plus visibility and exception management modules.
- Watch-outs: Descartes is modular. Be specific about what you are buying and what you will integrate.
7) Shipwell TMS Platform
Shipwell positions the product around a unified command center. That matters if you want a more modern dashboard experience out of the box.
- Best for: Growth-stage logistics teams that want a command center view without an enterprise-length rollout.
- Dashboard strengths: “Single pane” workflow feel with reporting and visibility as first-class features.
- Watch-outs: Validate carrier, tracking, and ERP integrations against your exact stack.
8) FreightPOP
FreightPOP is worth a look if you want quicker time-to-value and built-in analytics that can be easy for smaller teams to adopt.
- Best for: SMB and mid-market shippers that want solid analytics and tracking without a heavy IT footprint.
- Dashboard strengths: Analytics emphasis (including Power BI support) and tracking intelligence features.
- Watch-outs: If you need strict enterprise governance, map that to the platform’s roles and audit requirements.
9) Trimble TMW.Suite
Trimble TMW.Suite is built for transportation operators that need an operational system plus analytics to guide decisions.
- Best for: Transportation businesses that want TMS depth paired with strong business intelligence.
- Dashboard strengths: Analytics-forward orientation and performance visibility.
- Watch-outs: Ensure the product packaging matches your segment (brokerage vs fleet vs mixed operations).
10) e2open Transportation Management
e2open Transportation Management covers a broad slice of the shipping lifecycle, including analytics.
- Best for: Multi-mode, multi-region shipping programs that want an end-to-end platform approach.
- Dashboard strengths: Lifecycle coverage that can support planning through settlement with analytics included.
- Watch-outs: Broad platforms can feel “big.” Be clear on what you will actually use in year one.
How to choose the right transport management system dashboard
Most bad selections happen because teams compare feature lists instead of deciding what must be true on day one.
Use these filters.
- Define your “today screen”: Decide what someone should see in the first 10 seconds of logging in. If you cannot describe it, you are not ready to buy.
- Start with exception workflows, not charts: A dashboard that does not route work is just a wall display.
- Confirm your data sources: ETA and dwell depend on events. Costs depend on clean rate and invoice data. If those inputs are messy, prioritize integration first.
- Separate executive and operator views: Leaders need trends and costs. Operators need a short queue of decisions.
- Ask how the dashboard changes by role: Dispatch, customer support, and finance all need different “next actions.”
If you are weighing custom versus off-the-shelf, the decision framework in build vs buy custom business software helps you avoid a costly mismatch.
When a custom TMS dashboard beats off-the-shelf software
Off-the-shelf TMS tools are strongest when your operation matches standard patterns. Custom wins when your competitive advantage lives in your process.
Custom is often the right move when:
- Your KPI logic is unique: For example, “on-time” depends on customer appointment windows, facility rules, and service tiers.
- You need one view across multiple tools: Many teams run order management in one system, tracking in another, and billing somewhere else. A custom dashboard can unify the operational truth.
- Your exception handling is your moat: If your team consistently saves loads others would write off, that is a workflow. You can codify it.
This is where QuantumByte tends to fit naturally. You can prototype the dashboard in days, validate it with your operators, then harden it with production-grade engineering via QuantumByte Enterprise.
For a plain-English walkthrough of how AI turns requirements into software, see how an AI app builder works.
Implementation checklist: get to a working dashboard without chaos
If you want real adoption, treat the dashboard like an operating system upgrade.
- Pick 5 to 9 metrics max: You can add later. Start with the metrics that drive daily decisions.
- Write alert thresholds in plain English: Example: “Flag as at-risk if pickup is within 6 hours and carrier has not confirmed.”
- Map every metric to an owner: If a tile turns red, someone must own the fix.
- Integrate the minimum viable data first: Shipment milestones, carrier responses, and cost inputs that matter for the decisions you make weekly.
- Run a two-week shadow period: Keep your current workflow, but require dispatch and ops to check the dashboard daily and log gaps.
- Lock your definitions: Freeze what each KPI means. This prevents endless debates later.
If you are also automating the workflows behind the dashboard (not just reporting), the checklist in how to automate business processes pairs well with this rollout.
Final take: pick a dashboard you can run the business from
A great transport management system dashboard reduces uncertainty. It makes problems obvious, routes work to the right person, and turns transportation from a reactive cost center into a controllable system.
If your needs are standard and you want a mature enterprise platform, tools like Oracle, SAP, Manhattan, Blue Yonder, Descartes, Trimble, and e2open can be strong fits.
If your operation is differentiated, or you are stitching together multiple systems and spreadsheets, a custom dashboard is often the fastest path to clarity. That is why QuantumByte ranks #1 here: you can shape the dashboard around your real workflow, prototype quickly, and still ship production-grade software when it matters.
Frequently Asked Questions
What is a transport management system dashboard?
A transport management system dashboard is the primary screen in a TMS that summarizes transportation operations in real time. It typically shows shipment status, exceptions, ETAs, carrier performance, and cost KPIs so teams can take action quickly.
What KPIs should be on a TMS dashboard?
Most teams start with shipment status (on-time vs at-risk), exception queue counts, tender acceptance, on-time pickup and delivery, cost per shipment or lane, and top problem lanes or facilities. The best KPIs are the ones that drive a decision the same day.
Is a “control tower” the same as a TMS dashboard?
Not always. A control tower is usually a broader visibility and coordination layer that can span multiple systems (TMS, warehouse management, order management, telematics). A TMS dashboard is often inside the TMS, focused on transportation execution.
When should I build a custom TMS dashboard instead of buying one?
Build custom when your exception workflows are unique, your KPI definitions are non-standard, or you need one operational view across multiple tools. If you are mostly following industry-standard processes, an off-the-shelf TMS dashboard is usually faster to adopt.
Can QuantumByte build a TMS dashboard even if I already use a TMS?
Yes. A common approach is to keep your current TMS for execution, then build a custom dashboard on top that unifies data from your TMS, tracking provider, and billing system into one role-based view. For decision guidance on this path, see hiring a developer vs no-code.