
Most SMBs receive their financial reports 2-4 weeks after month-end. By then, they've already made decisions, hiring, spending, pricing, investing, based on outdated information. It's like driving while looking only in the rearview mirror, with a two-week delay.
Financial reporting automation changes this equation fundamentally. Real-time dashboards replace static reports. Instant insights replace month-end scrambles. Proactive alerts replace surprised reactions.
This guide shows you how to transform financial reporting from a lagging indicator to a leading edge for better business decisions.
The Reporting Time Lag Problem
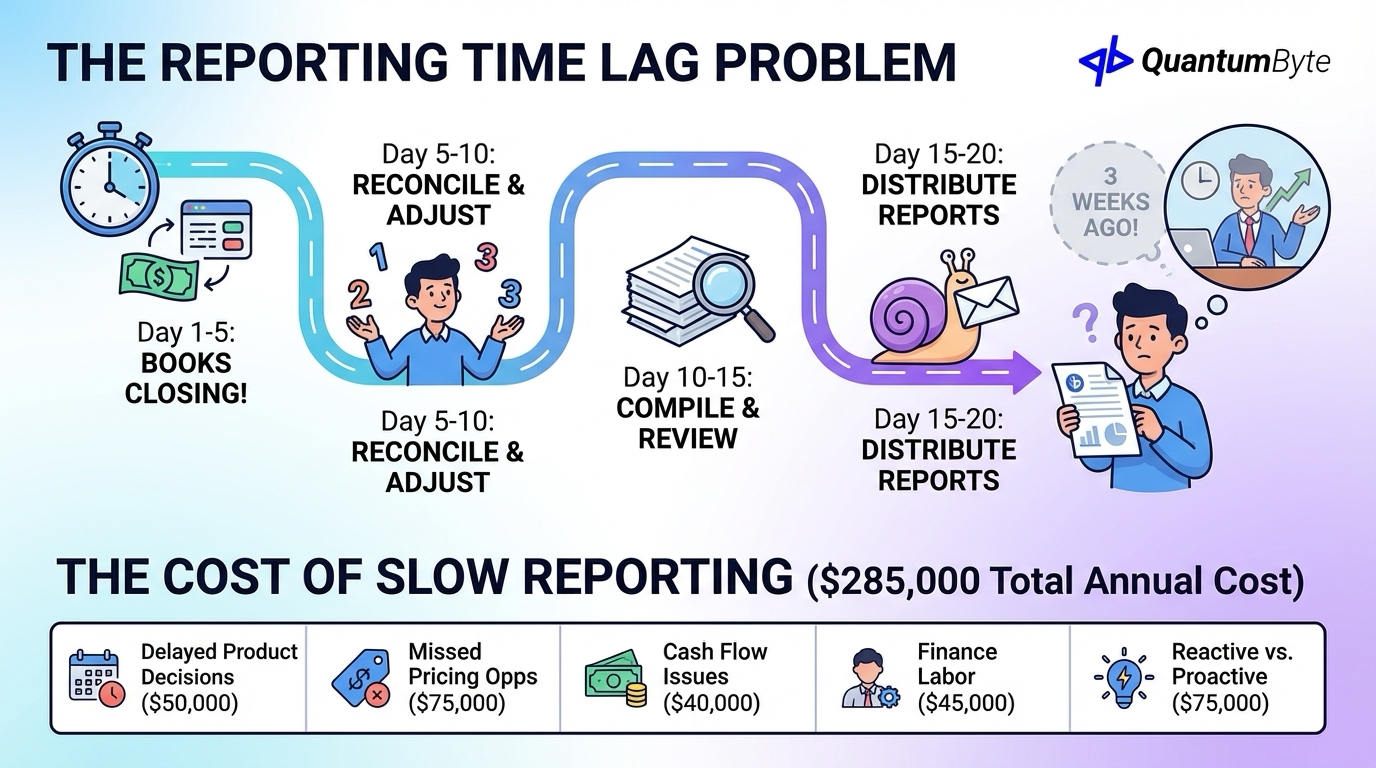
The traditional financial reporting timeline creates costly delays:
- Day 1-5: Transactions continue while books close
- Day 5-10: Finance team reconciles and adjusts
- Day 10-15: Reports compiled and reviewed
- Day 15-20: Reports distributed to stakeholders
By day 20, you're making decisions about a business that existed three weeks ago. Markets shift, customers change, and opportunities pass, all while you wait for reports.
The Cost of Slow Financial Reporting
Companies that optimize their reporting can shorten their financial close by up to 40%, enabling faster decision-making and potentially spending up to 60% more time on strategic analysis rather than manual data entry according to a study. Here's what slow reporting costs:
| Impact | Annual Cost |
|---|---|
| Delayed product decisions | $50,000 |
| Missed pricing opportunities | $75,000 |
| Cash flow management issues | $40,000 |
| Finance labor on report assembly | $45,000 |
| Reactive vs. proactive decisions | $75,000 |
| Total Annual Cost | $285,000 |
Essential Financial Reports to Automate
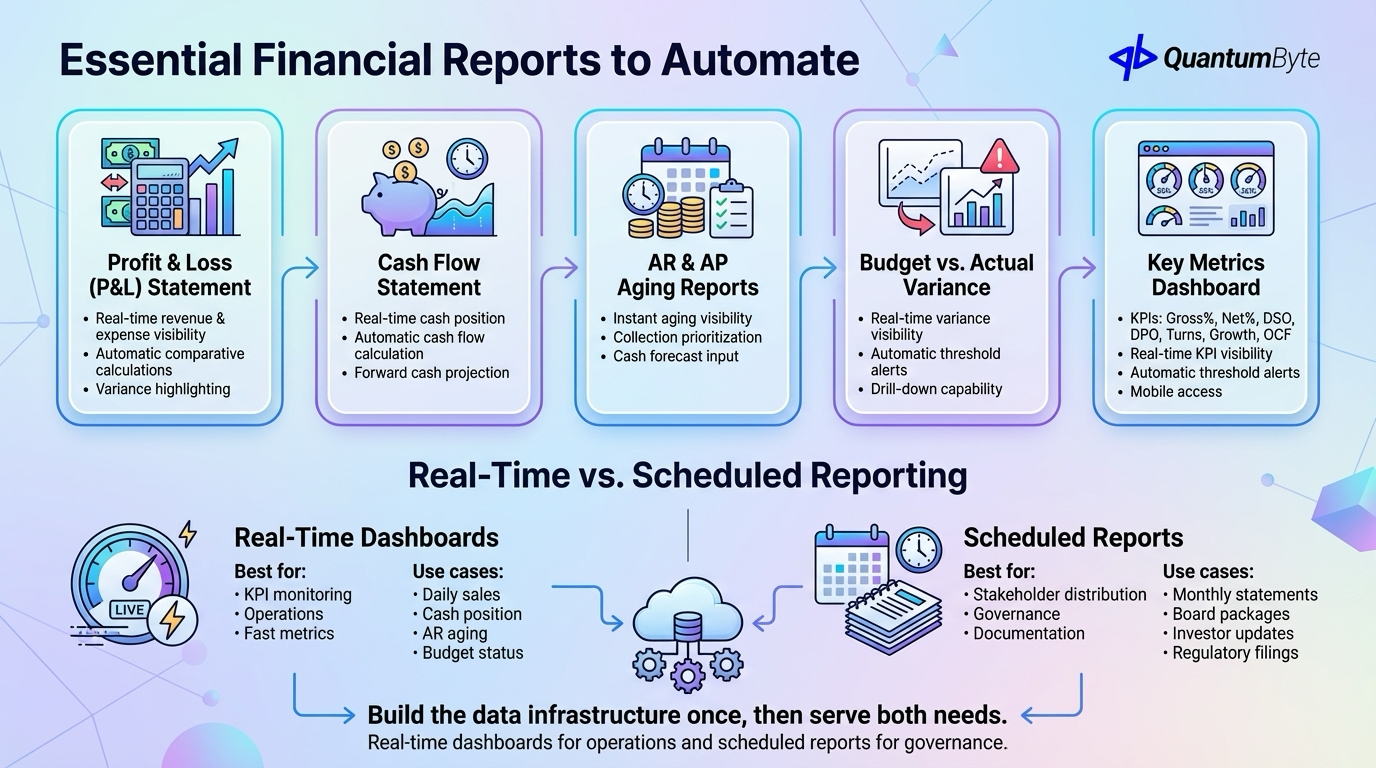
These reports deliver the highest value when automated:
1. Profit & Loss (P&L) Statement
Manual pain points: Data aggregation from multiple sources, allocation calculations, comparative period assembly.
Automation delivers: Real-time revenue and expense visibility, automatic comparative calculations, variance highlighting.
2. Cash Flow Statement
Manual pain points: Complex calculation methodology, working capital change tracking, forecast integration.
Automation delivers: Real-time cash position, automatic cash flow calculation, forward cash projection.
3. AR and AP Aging Reports
Manual pain points: Real-time accuracy challenges, customer/vendor consolidation, aging bucket calculations.
Automation delivers: Instant aging visibility, collection prioritization, cash forecast input.
4. Budget vs. Actual Variance Analysis
Manual pain points: Multiple budget versions, variance calculation, root cause identification.
Automation delivers: Real-time variance visibility, automatic threshold alerts, drill-down capability.
5. Key Metrics Dashboard
Essential KPIs at a glance, gross margin %, net margin %, DSO (Days Sales Outstanding), DPO (Days Payable Outstanding), inventory turns, revenue growth rate, and operating cash flow.
Automation delivers: Real-time KPI visibility, automatic threshold alerts, mobile access.
Real-Time vs. Scheduled Reporting
Different needs require different approaches:
Real-Time Dashboards
Best for: KPI monitoring, operations management, executive visibility, fast-moving metrics.
Use cases: Daily sales performance, cash position, AR aging, budget status.
Scheduled Reports
Best for: Stakeholder distribution, formal documentation, board packages, audit requirements.
Use cases: Monthly financial statements, board reporting packages, investor updates, regulatory filings.
Most businesses benefit from both, real-time dashboards for operations and scheduled reports for governance. Build the data infrastructure once, then serve both needs from the same foundation.
Building Financial Reporting Automation
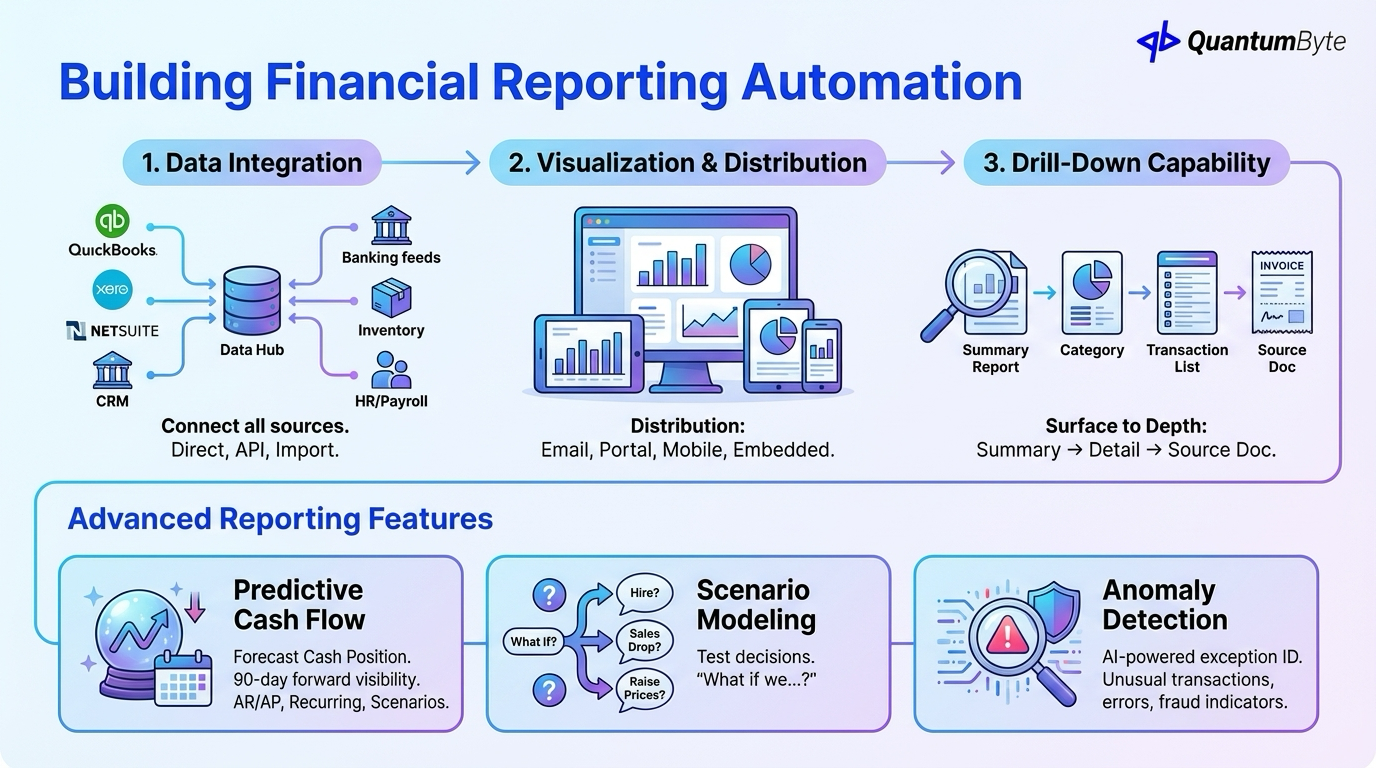
The architecture of reporting automation:
Data Integration
Connect all sources: accounting system (QuickBooks, Xero, NetSuite), banking feeds, CRM, inventory, operations, and HR/payroll.
Integration approaches: Direct database connection, API integration, file import automation.
Visualization and Distribution
Dashboards: Tools like Tableau or Power BI provide interactive, visual, real-time views.
Distribution: Email delivery, self-service portal access, mobile apps, embedded reporting.
Drill-Down Capability
Surface to depth: summary view → category drill-down → transaction detail → source documentation.
Advanced Reporting Features
Beyond basic automation:
Predictive Cash Flow
Forecast your cash position with AR collection prediction, AP timing analysis, recurring transaction modeling, and scenario variation.
Impact: 90-day forward visibility instead of historical-only view.
Scenario Modeling
Test decisions before making them: "What if we hire 2 people?" "What if sales drop 20%?" "What if we raise prices 10%?"
Anomaly Detection
AI-powered exception identification: unusual transactions, out-of-pattern trends, potential errors, fraud indicators.
ROI of Financial Reporting Automation
Quantify the returns:
Time Savings: 80% Reduction in Report Assembly
| Report | Manual Time | Automated Time | Savings |
|---|---|---|---|
| Monthly P&L | 8 hours | 1 hour | 87% |
| Cash Flow | 6 hours | 30 min | 92% |
| Budget variance | 10 hours | 1 hour | 90% |
| Sales analysis | 8 hours | 30 min | 94% |
| Total | 32 hours | 3 hours | 91% |
Example ROI: $5M Business
| Benefit Category | Annual Value |
|---|---|
| Report assembly time savings | $27,000 |
| Finance analyst redirection | $35,000 |
| Revenue opportunity capture | $80,000 |
| Cost control improvement | $25,000 |
| Cash management improvement | $15,000 |
| Total Annual Benefit | $182,000 |
| Implementation Cost | $20,000-35,000 |
| Payback Period | 2-3 months |
Implementation Roadmap
A structured 6-week path to financial reporting automation:
- Week 1: Define reports, metrics, and stakeholder requirements
- Week 2: Identify data sources and map structure
- Week 3: Build data integrations and transformation logic
- Week 4: Design dashboards and report templates
- Week 5: Test accuracy against manual calculations
- Week 6: Train team and launch
Building Your Financial Reporting System with QuantumByte
QuantumByte develops custom financial reporting apps that streamline your workflows:
- Connect to any data source: Cloud accounting, legacy systems, databases, APIs
- Custom report designs: Industry-specific metrics, custom calculations, stakeholder-specific views
- Real-time dashboards: Live data refresh, interactive exploration, mobile-responsive
- Scheduled report delivery: Email with attachments, PDF generation, custom schedules
- Secure role-based access: User authentication, permission levels, audit trail
Conclusion: From Lagging to Leading
Financial reporting automation transforms your relationship with your numbers:
From: Monthly reports delivered weeks late, static PDFs with no drill-down, finance team buried in compilation.
To: Real-time dashboards always current, interactive exploration, finance team focused on analysis.
The technology is accessible. The ROI is compelling. The competitive advantage is real.
Ready to transform your financial visibility? Schedule a consultation to explore your reporting automation opportunities.
Other Guides to Explore
- Invoice Automation: How to Get Paid Faster and Reduce Costs
- Accounting Automation Software: Reduce Manual Work and Improve Accuracy
- Expense Management Automation: Control Costs and Save Time
- How to Automate Business Processes to Increase Revenue in 2025
Frequently Asked Questions (FAQ)
How much does financial reporting automation cost?
Costs range from $15,000-50,000 for custom reporting systems, depending on data source complexity and report requirements. Cloud BI tools (Tableau, Power BI) run $10-75/user/month plus implementation.
Can reporting automation work with our existing accounting software?
Yes, reporting automation typically sits on top of your accounting system, pulling data via integration rather than replacing your general ledger. Most platforms (QuickBooks, Xero, NetSuite) have APIs that enable integration.
How accurate is automated reporting compared to manual?
When properly configured, automated reporting is more accurate than manual, no transcription errors, consistent calculations, and automatic updates. The key is validating during implementation.
How long does it take to implement financial reporting automation?
Basic dashboards with limited data sources: 2-4 weeks. Comprehensive reporting with multiple integrations: 6-10 weeks. Start with highest-priority reports and expand iteratively.